UNITED STATES
SECURITIES AND EXCHANGE COMMISSION
Washington, D.C. 20549
Form
ANNUAL REPORT PURSUANT TO SECTION 13 OR 15(d) OF
THE SECURITIES EXCHANGE ACT OF 1934
For the fiscal year ended
Commission file number
(Exact name of registrant as specified in its charter)
|
|
|
|
|
(State or Other Jurisdiction of Incorporation or Organization) |
|
(IRS Employer Identification No.) |
(Address of Principal Executive Offices) (Zip Code)
Registrant’s telephone number, including area code: (
Securities registered pursuant to Section 12(b) of the Act:
|
Title of each class |
Trading Symbols(s) |
Name of each exchange on which registered |
|
|
|
|
Securities registered pursuant to Section 12(g) of the Act: None
Indicate by check mark if the registrant is a well-known seasoned issuer, as defined in Rule 405 of the Securities Act.
Indicate by check mark if the registrant is not required to file reports pursuant to Section 13 or Section 15(d) of the Act. Yes ☐
Indicate by check mark whether the registrant (1) has filed all reports required to be filed by Section 13 or 15(d) of the Securities Exchange Act of 1934 during the preceding 12 months (or for such shorter period that the registrant was required to file such reports), and (2) has been subject to such filing requirements for the past 90 days.
Indicate by check mark whether the registrant has submitted electronically every Interactive Data File required to be submitted pursuant to Rule 405 of Regulation S-T during the preceding 12 months (or for such shorter period that the registrant was required to submit such files).
Indicate by check mark whether the registrant is a large accelerated filer, an accelerated filer, a non-accelerated filer, a smaller reporting company or emerging growth company. See the definitions of “large accelerated filer,” “accelerated filer”, “smaller reporting company” and “emerging growth company” in Rule 12b-2 of the Exchange Act.
|
Large accelerated filer |
☒ |
|
Accelerated filer |
☐ |
|
Non-accelerated filer |
☐ |
|
Smaller reporting company |
|
|
Emerging growth company |
|
|
|
|
|
|
|
|
|
|
If an emerging growth company, indicate by check mark if the registrant has elected not to use the extended transition period for complying with any new or revised financial accounting standards provided pursuant to Section 13(a) of the Exchange Act. ☐
Indicate by check mark whether the registrant is a shell company (as defined in Rule 12b-2 of the Act). Yes
The aggregate market value of the registrant’s voting common equity held by non-affiliates of the registrant at June 28, 2019 (the last day of the registrant’s most recent second quarter) was $
DOCUMENTS INCORPORATED BY REFERENCE
Certain information contained in the registrant’s proxy statement for its Annual Meeting of Stockholders to be held on April 28, 2020 (to be filed not later than 120 days after the end of the registrant’s fiscal year) (the “2020 Proxy Statement”) is incorporated by reference into Part III hereof.
Form 10-K Table of Contents
|
|
|
|
Page |
|
PART I |
|
|
|
|
Item 1. |
|
1 |
|
|
Item 1A. |
|
5 |
|
|
Item 1B. |
|
9 |
|
|
Item 2. |
|
9 |
|
|
Item 3. |
|
10 |
|
|
Item 4. |
|
10 |
|
|
|
|
10 |
|
|
|
|
|
|
|
PART II |
|
|
|
|
Item 5. |
|
11 |
|
|
Item 6. |
|
13 |
|
|
Item 7. |
Management’s Discussion and Analysis of Financial Condition and Results of Operations. |
|
14 |
|
|
|
15 |
|
|
|
|
18 |
|
|
|
|
22 |
|
|
Item 7A. |
|
27 |
|
|
Item 8. |
|
28 |
|
|
|
|
33 |
|
|
Item 9. |
Changes in and Disagreements With Accountants on Accounting and Financial Disclosure. |
|
68 |
|
Item 9A. |
|
68 |
|
|
Item 9B. |
|
68 |
|
|
|
|
|
|
|
PART III |
|
|
|
|
Item 10. |
|
69 |
|
|
Item 11. |
|
69 |
|
|
Item 12. |
Security Ownership of Certain Beneficial Owners and Management and Related Stockholder Matters. |
|
69 |
|
Item 13. |
Certain Relationships and Related Transactions, and Director Independence. |
|
69 |
|
Item 14. |
|
69 |
|
|
|
|
|
|
|
PART IV |
|
|
|
|
Item 15. |
|
70 |
|
|
Item 16. |
|
72 |
|
|
|
73 |
||
|
|
74 |
||
PART I
Item 1. Business.
Cautionary Statement Concerning Forward-Looking Statements
This Annual Report on Form 10-K contains certain “forward-looking statements” made pursuant to the safe harbor provisions of Section 27A of the Securities Act of 1933, as amended (the “Securities Act”), and Section 21E of the Securities Exchange Act of 1934, as amended (the “Exchange Act”), regarding expected capital spending, expected pension contributions, the anticipated effects of recently issued accounting standards on our financial statements, planned business strategies, market potential, future financial performance and other matters. Statements that include the words “believes,” “expects,” “anticipates,” “intends,” “projects,” “estimates,” “plans” and similar expressions or future or conditional verbs such as “will,” “should,” “would,” “may” and “could” are generally forward-looking in nature and not historical facts. Where, in any forward-looking statement, we express an expectation or belief as to future results or events, such expectation or belief is based on the current plans and expectations at the time this report is filed with the Securities and Exchange Commission (the “SEC”) or, with respect to any documents incorporated by reference, available at the time such document was prepared or filed with the SEC. Although we believe that these statements are based on reasonable assumptions, they are subject to numerous factors, risks and uncertainties that could cause actual outcomes and results to be materially different from those indicated in such statements. These factors include those listed in the section below entitled “Risk Factors.” Except as required by law, we undertake no obligation to update or revise any forward-looking statements to reflect changed assumptions, the occurrence of anticipated or unanticipated events, new information or changes to future results over time or otherwise.
Unless the context otherwise requires, references in this Annual Report on Form 10-K to “Fortune Brands,” the “Company,” “we,” “our” or “us” refer to Fortune Brands Home & Security, Inc. and its consolidated subsidiaries.
Our Company
We are a leading home and security products company that competes in attractive long-term growth markets in our product categories. With a foundation of market-leading brands across a diversified mix of channels, and lean and flexible supply chains, as well as a tradition of strong product innovation and customer service, we are focused on outperforming our markets in both growth and returns, and driving increased shareholder value. We have three business segments: Cabinets, Plumbing, and Doors & Security. We sell our products through a wide array of sales channels, including kitchen and bath dealers, wholesalers oriented toward builders or professional remodelers, industrial and locksmith distributors, “do-it-yourself” remodeling-oriented home centers and other retail outlets. We believe the Company’s impressive track record reflects the long-term attractiveness and potential of our categories and our leading brands. Despite increased pressures driven in part by tariffs, higher commodity costs and higher interest rates, our performance demonstrates the strength of our operating model and our ability to generate profitable growth as sales volume increases and we leverage our structural competitive advantages to gain share in our categories.
Our Strategy
Build on leading business and brand positions in attractive growth and return categories. We believe that we have leading market positions and brands in many of our product categories in the Unites States. In Cabinets, we continued our targeted initiatives throughout 2019 to grow in the value priced segments of the market. Moen continued to grow its brand presence in our targeted ”entry-level” demographics including millennial home buyers. During 2019 and since acquiring Fiberon (our composite decking and railing business) in 2018, we significantly expanded our distribution partnerships for the brand in the Midwest and Western regions of the U.S., including a major new distribution partnership with Orepac. We also strive to leverage our brands by expanding into adjacent product categories and continue to develop new programs by working closely with our partners and customers.
Continue to develop innovative products for customers, designers, installers and consumers. Sustained investments in consumer-driven product innovation and customer service, along with our low-cost structures, have contributed to our success in the marketplace and creating consumer demand. In 2019, our Global Plumbing Group continued to develop products with our partners in the “whole home” and “smart home” water space including the Flo by Moen Smart Water Shut Off, which was launched in 2019 and the Flo by Moen Smart Water Detector and U by Moen Smart Faucet, which were launched in early 2020. Moen also worked with partners in 2019 to develop new technologies and designs. In 2019, MasterBrand Cabinets, which provides a wide range of cabinets for the home, focused on the shift in the marketplace toward stock cabinetry and introduced Mantra, a new value-priced cabinet line. MasterBrand Cabinets continued to develop innovative new cabinet door designs, lighting systems, color palettes and features in a range of styles that allow consumers to create a custom kitchen look at an affordable price and introduced new, exclusive laminate door and finish options across multiple price segments. We continue to provide channel support with responsive websites featuring our cabinet brands that drives consumers to our partner dealers. The Therma-Tru portfolio of on-trend door and glass collections continued to evolve to meet current and emerging architectural
1
design trends including additional decorative, privacy and textured glass designs and door surrounds. In 2019, Fiberon expanded its offering of premium PVC decking products and also brought new products to its railing category. Master Lock continued to be an innovation leader in security and safety products and services, driven by consumer and end user focused insights with continued emphasis on electronic enabled solutions for enhanced capability and convenience. SentrySafe continued to provide a full portfolio of quality security, fire and water resistant safes to help consumers and small business owners protect documents and valuables.
Expand in international markets. We expect to have opportunities to expand sales by further penetrating international markets, which represented approximately 16% of net sales in 2019. We continue to develop our relationship with dealers and distributors and their Moen-branded stores throughout China. In our Cabinets segment, WoodCrafters sold and launched a variety of cabinetry products in Mexico.
Leverage our global supply chains. We are using lean manufacturing, design-to-manufacture and distributive assembly techniques to make our supply chains more flexible and improve supply chain quality, cost, response times and asset efficiency. We view our global supply chains and manufacturing presence as a strategic asset not only to support strong operating leverage as volumes increase, but also to enable the profitable growth of new products, adjacent market expansion and international growth.
Enhance returns and deploy our cash flow to high-return opportunities. We continue to believe our most attractive opportunities are to invest in profitable organic growth initiatives, pursue accretive strategic acquisitions, non-controlling equity investments, and joint ventures, and return cash to stockholders through a combination of dividends and repurchases of shares of our common stock. In 2019, we repurchased approximately 2 million shares of our outstanding common stock under the Company’s share repurchase program for $100 million and returned $123 million to stockholders through dividends.
Invest in our employees and community and conduct business responsibly. We believe that holding our team, our suppliers and the products that we deliver to a high set of standards strengthens our company and builds a foundation for lasting success and shareholder value creation. Our emphasis on our employee’s safety has resulted in fewer recordable incidents and lower lost time rates.
Our Competitive Strengths
We believe our competitive strengths include the following:
Leading brands. We have leading brands in many of our product categories. We believe that established brands are meaningful to both consumers and trade customers in their respective categories and that we have the opportunity to, among other things, gain share in the marketplace and continue to expand many of our brands into adjacent product categories and international markets.
Strategic focus on attractive consumer-facing categories. We believe we operate in categories that, while very competitive, are among the more attractive categories in the home products and security products markets. Some of the key characteristics that make these categories attractive in our view include the following:
|
• |
product quality, innovation, fashion, finish, durability and functionality, which are key determinants of product selection in addition to price; |
|
• |
established brands, which are meaningful to both consumers and trade customers; |
|
• |
the opportunity to add value to a complex consumer purchasing decision with excellent service propositions, reliability of products, ease of installation and superior delivery lead times; |
|
• |
the value our products add to a home, particularly with kitchen and bath remodeling and additions, the curb appeal offered by stylish entry door systems and the expanding outdoor living market offered through our decking products; |
|
• |
favorable long-term trends in household formations that benefit the outlook for our markets over time; |
|
• |
the relatively stable demand for plumbing and security products; and |
|
• |
the opportunity to expand into adjacent categories. |
Operational excellence. In 2019, we invested approximately $58 million to support long-term growth potential and new products both in the U.S. and international markets. In addition, our supply chains and low cost manufacturing structures allow us to adapt to challenging market conditions, including the impact of tariffs. We believe that margin improvement will continue to be driven predominantly by organic volume growth that can be readily accommodated by current production capacity.
2
Commitment to innovation. We have a long track record of successful product and process innovations that introduce valued new products and services to our customers and consumers. We are committed to continuing to invest in new product development and enhance customer service to strengthen our leading brands and penetrate adjacent markets.
Diverse sales end-use mix. We sell in a variety of product categories and sales channels in the U.S. home and security products markets. In addition, our exposure to changing levels of U.S. residential new home construction activity is balanced with repair-and-remodel activity, which comprised a substantial majority of the overall U.S. home products market and about two-thirds of our U.S. home products sales in 2019. We also benefit from a stable market for plumbing and security products and international sales growth opportunities.
Diverse sales channels. We sell through a wide array of sales channels, including kitchen and bath dealers, wholesalers oriented to builders or professional remodelers, industrial and locksmith distributors, “do-it-yourself” remodeling-oriented home centers and other retail outlets. We are able to leverage these existing sales channels to expand into adjacent product categories. In 2019, sales to our top ten customers represented less than half of total sales.
Decentralized business model. Our business segments are focused on distinct product categories and are responsible for their own performance. This structure enables each of our segments to independently best position itself within each category in which it competes, while gaining the benefit of cross-company synergies. This structure also reinforces strong accountability for operational and financial performance. Each of our segments focuses on its unique set of consumers, customers, competitors and suppliers, while also sharing best practices.
Strong capital structure. We exited 2019 with a strong balance sheet. As of December 31, 2019, we had $387.9 million of cash and cash equivalents and total debt was $2,184.3 million, resulting in a net debt position of $1,796.4 million. In addition, we had $1,250.0 million available under our credit facility as of December 31, 2019.
Business Segments
We have three business segments: Cabinets, Plumbing and Doors & Security. The following table shows net sales for each of these segments and key brands within each segment:
|
Segment |
|
2019 Net Sales (in millions) |
|
|
Percentage of Total 2019 Net Sales |
|
|
Key Brands |
||
|
Cabinets |
|
$ |
2,388.5 |
|
|
|
41.4 |
% |
|
Diamond, Aristokraft, Mid-Continent, Kitchen Craft, Homecrest, Omega, StarMark, Ultracraft, Kemper, Schrock, Decora, Mantra |
|
Plumbing |
|
|
2,027.2 |
|
|
|
35.2 |
% |
|
Moen, Riobel, ROHL, Victoria +Albert, Perrin & Rowe, Shaws |
|
Doors & Security |
|
|
1,348.9 |
|
|
|
23.4 |
% |
|
Therma-Tru, Master Lock, Fiberon, SentrySafe, Fypon, American Lock |
|
Total |
|
$ |
5,764.6 |
|
|
|
100.0 |
% |
|
|
Our segments compete on the basis of innovation, fashion, quality, price, service and responsiveness to distributor, retailer and installer needs, as well as end-user consumer preferences. Our markets are very competitive. Approximately 16% of 2019 net sales were to international markets, and sales to two of the Company’s customers, The Home Depot, Inc. (“The Home Depot”) and Lowe’s Companies, Inc. (“Lowe’s”), each accounted for more than 14% of the Company’s net sales in 2019. Sales to all U.S. home centers in the aggregate were approximately 29% of net sales in 2019.
Cabinets. Our Cabinets segment manufactures high quality stock, semi-custom and custom cabinetry, as well as vanities, for the kitchen, bath and other parts of the home through a regional supply chain footprint to deliver high quality cabinets and service to our customers. This segment sells a portfolio of brands that enables our customers to differentiate themselves against competitors. This portfolio includes brand names such as, Diamond, Aristokraft, Mid-Continent, Kitchen Craft, Homecrest, Omega, StarMark, Ultracraft, Kemper, Schrock, Decora and Mantra. Substantially all of this segment’s sales are in North America. This segment sells directly to kitchen and bath dealers, home centers, wholesalers and large builders. In aggregate, sales to The Home Depot and Lowe’s comprised approximately 36% of net sales of the Cabinets segment in 2019. This segment’s competitors include ACPI (formerly Masco Cabinetry) and American Woodmark, as well as a large number of overseas, regional and local suppliers.
3
Plumbing. Our Plumbing segment manufactures or assembles and sells faucets, accessories, kitchen sinks and waste disposals, predominantly under the Moen, Riobel, ROHL, Victoria+Albert, Perrin & Rowe and Shaws brands. Although this segment sells products principally in the U.S., China and Canada, this segment also sells in Mexico, Southeast Asia, Europe and South America. Approximately 30% of 2019 net sales were to international markets. This segment sells directly through its own sales force and indirectly through independent manufacturers’ representatives, primarily to wholesalers, home centers, mass merchandisers and industrial distributors. In aggregate, sales to The Home Depot and Lowe’s comprised approximately 23% of net sales of the Plumbing segment in 2019. This segment’s chief competitors include Masco, Kohler, Spectrum Brands, LIXIL Group, InSinkErator (owned by Emerson Electronic Company) and imported private-label brands.
Doors & Security. Our Doors & Security segment manufactures and sells fiberglass and steel entry door systems under the Therma-Tru brand name, composite decking and railing under the Fiberon brand name, and urethane millwork under the Fypon brand name. It also manufactures, sources and distributes locks, safety and security devices, and electronic security products under the Master Lock and American Lock brands and fire resistant safes, security containers and commercial cabinets under the SentrySafe brand. This segment sells products principally in the U.S., Canada, Europe, Central America, Japan and Australia. Approximately 13% of 2019 net sales were to international markets. This segment’s principal customers are home centers, hardware and other retailers, millwork building products and wholesale distributors, and specialty dealers that provide products to the residential new construction market, as well as to the remodeling and renovation markets. In addition, it sells lock systems and fire resistant safes to locksmiths, industrial and institutional users, and original equipment manufacturers. In aggregate, sales to The Home Depot and Lowe’s comprised approximately 23% of net sales of the Doors & Security segment in 2019. Therma-Tru, Fiberon and Fypon brands compete with Masonite, JELD-WEN, Trex, Azek, Plastpro, Pella and various regional and local suppliers. The Master Lock brand competes with Abus, W.H. Brady, Hampton, Spectrum Brands, Allegion, Assa Abloy and various imports. The SentrySafe brand competes with Magnum, Fortress, Interlocks and Stack-On.
Annual net sales for each of the last three fiscal years for each of our business segments were as follows:
|
(In millions) |
|
2019 |
|
|
|
2018 |
|
|
2017 |
|
|||
|
Cabinets |
|
$ |
2,388.5 |
|
|
|
$ |
2,418.6 |
|
|
$ |
2,467.1 |
|
|
Plumbing |
|
|
2,027.2 |
|
|
|
|
1,883.3 |
|
|
|
1,720.8 |
|
|
Doors & Security |
|
|
1,348.9 |
|
|
|
|
1,183.2 |
|
|
|
1,095.4 |
|
|
Total |
|
$ |
5,764.6 |
|
|
|
$ |
5,485.1 |
|
|
$ |
5,283.3 |
|
For additional financial information for each of our business segments, refer to Note 20, “Information on Business Segments,” to the Consolidated Financial Statements in Item 8 of this Annual Report on Form 10-K.
Other Information
Raw materials. The table below indicates the principal raw materials used by each of our segments. These materials are available from a number of sources. Volatility in the prices of commodities and energy used in making and distributing our products impacts the cost of manufacturing our products.
|
Segment |
Raw Materials |
|
Cabinets |
Hardwoods (maple, cherry and oak), plywood and particleboard |
|
Plumbing |
Brass, zinc, resins, stainless steel and aluminum |
|
Doors & Security |
Wood, resins, steel, glass, aluminum, plastics and insulating foam |
Intellectual property. Product innovation and branding are important to the success of our business. In addition to the brand protection offered by our trademarks, patent protection helps distinguish our unique product features in the market by preventing copying and making it more difficult for competitors to benefit unfairly from our design innovation. We hold U.S. and foreign patents covering various features used in products sold within all of our business segments. Although each of our segments relies on a number of patents and patent groups that, in the aggregate, provide important protections to the Company, no single patent or patent group is material to any of the Company’s segments.
Employees. As of December 31, 2019, we had approximately 24,700 full-time employees. Approximately 3,200 of these employees are covered by collective bargaining agreements. Employee relations are generally good.
Seasonality. All of our operating segments traditionally experience lower sales in the first quarter of the year when new home construction, repair-and-remodel activity and security buying are at their lowest. As a result of sales seasonality and associated timing of working capital fluctuations, our cash flow from operating activities is typically higher in the second half of the year.
4
Environmental matters. We are involved in remediation activities to clean up hazardous wastes as required by federal and state laws. Liabilities for remediation costs of each site are based on our best estimate of undiscounted future costs, excluding possible insurance recoveries or recoveries from other third parties. Uncertainties about the status of laws, regulations, technology and information related to individual sites make it difficult to develop estimates of future environmental remediation exposures. Some of the potential liabilities relate to sites we own, and some relate to sites we no longer own or never owned. Several of our subsidiaries have been designated as potentially responsible parties (“PRP”) under “Superfund” or similar state laws. As of December 31, 2019, ten such instances have not been dismissed, settled or otherwise resolved. In 2019, none of our subsidiaries were identified as a PRP in a new instance and no instances were settled, dismissed or otherwise resolved. In most instances where our subsidiaries are named as a PRP, we enter into cost-sharing arrangements with other PRPs. We give notice to insurance carriers of potential PRP liability, but very rarely, if ever, receive reimbursement from insurance for PRP costs. We believe that the cost of complying with the present environmental protection laws, before considering estimated recoveries either from other PRPs or insurance, will not have a material adverse effect on our results of operations, cash flows or financial condition. At December 31, 2019 and 2018, we had accruals of $0.2 and $0.6 million, respectively, relating to environmental compliance and cleanup including, but not limited to, the above mentioned Superfund sites.
Legal structure. Fortune Brands Home & Security, Inc. is a holding company that was initially organized as a Delaware corporation in 1988. Wholly-owned subsidiaries of the Company include MasterBrand Cabinets, Inc., Fortune Brands Global Plumbing Group LLC, Fortune Brands Doors, Inc. and Fortune Brands Storage & Security LLC. As a holding company, we are a legal entity separate and distinct from our subsidiaries. Accordingly, the rights of the Company, and thus the rights of our creditors (including holders of debt securities and other obligations) and stockholders to participate in any distribution of the assets or earnings of any subsidiary is subject to the claims of creditors of the subsidiary, except to the extent that claims of the Company itself as a creditor of such subsidiary may be recognized, in which event the Company’s claims may in certain circumstances be subordinate to certain claims of others. In addition, as a holding company, the source of our unconsolidated revenues and funds is dividends and other payments from subsidiaries. Our subsidiaries are not limited by long-term debt or other agreements in their abilities to pay cash dividends or to make other distributions with respect to their capital stock or other payments to the Company.
Available Information. The Company’s website address is www.FBHS.com. The Company’s annual report on Form 10-K, quarterly reports on Form 10-Q, current reports on Form 8-K and any amendments to these reports are available free of charge on the Company’s website as soon as reasonably practicable after the reports are filed or furnished electronically with the SEC. Reports filed with the SEC are also made available on its website at www.sec.gov. We also make available on our website, or in printed form upon request, free of charge, our Corporate Governance Principles, Code of Business Conduct and Ethics, Code of Ethics for Senior Financial Officers, Charters for the Committees of our Board of Directors and certain other information related to the Company.
Item 1A. Risk Factors.
There are inherent risks and uncertainties associated with our business that could adversely affect our business, financial condition or operating results. Set forth below are descriptions of those risks and uncertainties that we currently believe to be material, but the risks and uncertainties described below are not the only risks and uncertainties that could adversely affect our business, financial condition or operating results. If any of these risks materialize, our business, financial condition or operating results could suffer. In this case, the trading price of our common stock could decline, and you may lose all or part of your investment.
Risks Relating to Our Business
Our business primarily relies on North American home improvement, repair and remodel and new home construction activity levels, all of which are impacted by risks associated with fluctuations in the housing market. Downward changes in the general economy, the housing market or other business conditions could adversely affect our results of operations, cash flows and financial condition.
Our business primarily relies on home improvement, repair and remodel, and new home construction activity levels, principally in North America. The housing market is sensitive to changes in economic conditions and other factors, such as the level of employment, access to labor, consumer confidence, consumer income, government tax programs, availability of financing and interest rate levels. Adverse changes in any of these conditions generally, or in any of the markets where we operate, could decrease demand and could adversely impact our businesses by: causing consumers to delay or decrease homeownership; making consumers more price conscious resulting in a shift in demand to smaller, less expensive homes; making consumers more reluctant to make investments in their existing homes, including large kitchen and bath repair and remodel projects; or making it more difficult to secure loans for major renovations.
5
We operate in very competitive consumer and trade brand categories.
The markets in which we operate are very competitive. Although we believe that competition in our businesses is based largely on product quality, consumer and trade brand reputation, customer service and product features, as well as fashion trends, innovation and ease of installation, price is a significant factor for consumers as well as our trade customers. Some of our competitors may resort to price competition to sustain or grow market share and manufacturing capacity utilization. Also, certain large customers continue to offer private-label brands that compete with some of our product offerings as a lower-cost alternative. We also face increasing pressure from imported ‘flat pack’ cabinets. The strong competition that we face in all of our businesses may adversely affect our profitability and revenue levels, as well as our results of operations, cash flows and financial condition.
Risks associated with our ability to improve organizational productivity and global supply chain efficiency and flexibility could adversely affect our results of operations, cash flows and financial condition.
We regularly evaluate our organizational productivity and global supply chains and assess opportunities to increase capacity, reduce costs and enhance quality. We may be unable to enhance quality, speed and flexibility to meet changing and uncertain market conditions, as well as manage cost inflation, including wages, pension and medical costs. Our success depends in part on refining our cost structure and supply chains to promote consistently flexible and low cost supply chains that can respond to market changes to protect profitability and cash flow or ramp up quickly and effectively to meet demand. Import tariffs could potentially lead to increases in prices of raw materials or components which are critical to our business. Failure to achieve the desired level of quality, capacity or cost reductions could impair our results of operations, cash flows and financial condition.
We may not successfully develop new products or processes or improve existing products or processes.
Our success depends on meeting consumer needs and anticipating changes in consumer preferences with successful new products and product improvements. We aim to introduce products and new or improved production processes proactively to offset obsolescence and decreases in sales of existing products. We may not be successful in product development and our new products may not be commercially successful. In addition, it is possible that competitors may improve their products or processes more rapidly or effectively, which could adversely affect our sales. Furthermore, market demand may decline as a result of consumer preferences trending away from our categories or trending down within our brands or product categories, which could adversely impact our results of operations, cash flows and financial condition.
Risks associated with global commodity and energy availability and price volatility, as well as the possibility of sustained inflation, could adversely affect our results of operations, cash flows and financial condition.
We are exposed to risks associated with global commodity price volatility arising from restricted or uneven supply conditions, the sustained expansion and volatility of demand from emerging markets, potentially unstable geopolitical and economic variables, weather and other unpredictable external factors. We buy raw materials that contain commodities such as brass, zinc, steel, wood, and glass and petroleum-based products such as resins. In addition, our distribution costs are significantly impacted by the price of oil and diesel fuel. Decreased availability and increased or volatile prices for these commodities, as well as energy used in making, distributing and transporting our products, could increase the costs of our products. While in the past we have been able to mitigate the impact of these cost increases through productivity improvements and passing on increasing costs to our customers over time, there is no assurance that we will be able to offset such cost increases in the future, and the risk of potentially sustained high levels of inflation could adversely impact our results of operations, cash flows and financial condition. While we may use derivative contracts to limit our short-term exposure to commodity price volatility, the commodity exposures under these contracts could still be material to our results of operations, cash flows and financial condition. In addition, in periods of declining commodity prices, these derivative contracts may have the short-term effect of increasing our expenditures for these raw materials.
We manufacture, source and sell products internationally and are exposed to risks associated with doing business globally, including risks associated with uncertain trade environments.
We manufacture, source or sell our products in a number of locations throughout the world, predominantly in the U.S., Canada, China, Europe and Mexico. Accordingly, we are subject to risks associated with potential disruption caused by changes in political, economic and social environments, including civil and political unrest, illnesses declared as a public health emergency (including viral pandemics), terrorism, possible expropriation, local labor conditions, changes in laws, regulations and policies of foreign governments and trade disputes with the U.S., and U.S. laws affecting activities of U.S. companies abroad. We could be adversely affected by international trade regulations, including duties, tariffs and antidumping penalties. Risks inherent to international operations include: potentially adverse tax laws, unfavorable changes or uncertainty relating to trade agreements or importation duties, uncertainty regarding clearance and enforcement of intellectual property rights, risks associated with the Foreign Corrupt Practices Act, mandatory or voluntary shutdowns of our facilities or our suppliers due to changes in political, economic or health emergencies and difficulty enforcing contracts. While we hedge certain foreign currency transactions, a change in the value of the currencies will impact our financial statements when translated into U.S. dollars. In addition, fluctuations in currency can adversely impact the cost position of our products in local currency, making it more difficult for us to compete. Our success will depend, in part, on our ability to effectively manage our businesses through the impact of these potential changes. In addition, we source certain raw materials, components and finished goods from China where we have
6
experienced higher manufacturing costs and longer lead times due to higher tariffs, currency fluctuations, higher wage rates, labor shortages and higher raw material costs.
Changes in government and industry regulatory standards could adversely affect our results of operations, cash flows and financial condition.
Government regulations and policies pertaining to trade agreements, health and safety (including protection of employees as well as consumers), taxes and environmental concerns continue to emerge domestically, as well as internationally. In particular, there may be additional tariffs or taxes related to our imported raw materials, components and finished goods. It is necessary for us to comply with current requirements (including requirements that do not become effective until a future date), and even more stringent requirements could be imposed on our products or processes in the future. Compliance with changes in taxes, tariffs and other regulations may require us to alter our manufacturing and installation processes and our sourcing. Such actions could increase our capital expenditures and adversely impact our results of operations, cash flows and financial condition.
Risks associated with strategic acquisitions and joint ventures could adversely affect our results of operations, cash flows and financial condition.
We consider acquisitions and joint ventures as a means of enhancing shareholder value. Acquisitions and joint ventures involve risks and uncertainties, including difficulties integrating acquired companies and operating joint ventures; difficulties retaining the acquired businesses’ customers and brands; the inability to achieve the expected financial results and benefits of transactions; the loss of key employees from acquired companies; implementing and maintaining consistent standards, controls, policies and information systems; and diversion of management’s attention from other business matters. Future acquisitions could cause us to incur additional debt or issue additional shares, resulting in dilution in earnings per share and return on capital.
Our inability to secure and protect our intellectual property rights could negatively impact revenues and brand reputation.
We have many patents, trademarks, brand names and trade names that, in the aggregate, are important to our business. Unauthorized use of these intellectual property rights may not only erode sales of our products, but may also cause significant damage to our brand name and reputation, interfere with our ability to effectively represent the Company to our customers, contractors and suppliers, and increase litigation costs. There can be no assurance that our efforts to protect our brands and trademark rights will prevent violations. In addition, existing patent, trade secret and trademark laws offer only limited protection, and the laws of some countries in which our products are or may be developed, manufactured or sold may not fully protect our intellectual property from infringement by others. There can be no assurance that our efforts to assess possible third party intellectual property rights will ensure the Company’s ability to manufacture, distribute, market or sell in any given country or territory. Furthermore, others may assert intellectual property infringement claims against us or our customers.
Our businesses rely on the performance of wholesale distributors, dealers and other marketing arrangements and could be adversely affected by poor performance or other disruptions in our distribution channels and customers.
We rely on a distribution network comprised of consolidating customers. Any disruption to the existing distribution channels could adversely affect our results of operations, cash flows and financial condition. The consolidation of distributors or the financial instability or default of a distributor or one of its major customers could potentially cause such a disruption. In addition to our own sales force, we offer our products through a variety of third-party distributors, representatives and retailers. Certain of our distributors, representatives or retailers may also market other products that compete with our products. The loss or termination of one or more of our major distributors, representatives or retailers, the failure of one or more of our distributors, representatives or retailers to effectively promote our products, or changes in the financial or business condition of these distributors, representatives or retailers could adversely effect our ability to bring products to market.
Risks associated with the disruption of operations could adversely affect our results of operations, cash flows and financial condition.
We manufacture a significant portion of the products we sell. Any prolonged disruption in our operations, whether due to technical or labor difficulties, weather, lack of raw material or component availability, startup inefficiencies for new operations, destruction of or damage to any facility (as a result of natural disasters, fires and explosions, use and storage of hazardous materials or other events) or other reasons, could negatively impact our profitability and competitive position and adversely affect our results of operations, cash flows and financial condition.
Our inability to obtain raw materials and finished goods in a timely and cost-effective manner from suppliers could adversely affect our ability to manufacture and market our products.
We purchase raw materials to be used in manufacturing our products and also rely on third-party manufacturers as a source for finished goods. We typically do not enter into long-term contracts with our suppliers or sourcing partners. Instead, most raw materials and sourced goods are obtained on a “purchase order” basis. In addition, in some instances we maintain single-source or limited-source sourcing relationships, either because multiple sources are not available or the relationship is advantageous due to performance, quality, support, delivery, capacity or price considerations. Financial, operating or other difficulties encountered by our suppliers or sourcing partners or changes in our relationships with them could result in
7
manufacturing or sourcing interruptions, delays and inefficiencies, and prevent us from manufacturing or obtaining the finished goods necessary to meet customer demand. If we are unable to meet customer demand, there could be an adverse effect on our results of operations, cash flows and financial condition.
Our failure to attract and retain qualified personnel and other labor constraints could adversely affect our results of operations, cash flows and financial condition.
Our success depends in part on the efforts and abilities of qualified personnel at all levels, including our senior management team and other key employees. Their motivation, skills, experience, contacts and industry knowledge significantly benefit our operations and administration. With low unemployment rates in the U.S., competition for qualified talent and attracting and retaining personnel in remote locations could result in the failure to attract, motivate and retain personnel, which could have an adverse effect on our results of operations, cash flows and financial condition.
Impairment charges could have a material adverse effect on the Company’s financial results.
Goodwill and other acquired intangible assets expected to contribute indefinitely to our cash flows are not amortized, but must be evaluated for impairment by management at least annually. If the carrying value exceeds the implied fair value of goodwill, the goodwill is considered impaired and is reduced to fair value via a non-cash charge to earnings. If the carrying value of an indefinite-lived intangible asset is greater than its fair value, the intangible asset is considered impaired and is reduced to fair value via a non-cash charge to earnings. During the years ended December 31, 2019 and 2018, we recorded non-cash impairment charges related to indefinite lived intangibles of $41.5 million and $62.6 million, respectively. Future events may occur that would adversely affect the fair value of our goodwill or other acquired intangible assets and require impairment charges. Such events may include, but are not limited to, lower than forecasted revenues, actual new construction and repair and remodel growth rates that fall below our assumptions, actions of key customers, increases in discount rates, continued economic uncertainty, higher levels of unemployment, weak consumer confidence, lower levels of discretionary consumer spending, a decrease in royalty rates and a decline in the trading price of our common stock. We continue to evaluate the impact of economic and other developments to assess whether impairment indicators are present. Accordingly, we may be required to perform impairment tests based on changes in the economic environment and other factors, and these tests could result in impairment charges in the future. Given the Company’s impairment charges in 2019 and 2018, there is minimal difference between the estimated fair values and the carrying values of some our indefinite-lived intangible assets, increasing the possibility of future impairment charges.
We may experience delays or outages in our information technology systems and computer networks. We may be subject to breaches of our information technology systems, which could damage our reputation and consumer relationships. Such breaches could subject us to significant financial, legal and operational consequences.
We, like most companies, may be subject to information technology system failures and network disruptions caused by delays or disruptions due to system updates, natural disasters, malicious attacks, accidents, power disruptions, telecommunications failures, acts of terrorism or war, computer viruses, physical or electronic break-ins, or similar events or disruptions. Our businesses may implement enterprise resource planning systems or add applications to replace outdated systems and to operate more efficiently. We may not be able to successfully implement the projects without experiencing difficulties. In addition, any expected benefits of implementing projects might not be realized or the costs of implementation might outweigh the benefits realized. In addition, information security risks have generally increased in recent years because of the proliferation of new technologies and the increased sophistication and activities of perpetrators of cyber-attacks. We believe we devote appropriate resources to network security, data encryption, and other security measures to protect our systems and data, but these security measures cannot provide absolute security. In the event of a breach, we would be exposed to a risk of loss or litigation and possible liability, which could have an adverse effect on our business, results of operations, cash flows and financial condition.
Our pension costs and funding requirements could increase as a result of volatility in the financial markets and changes in interest rates and actuarial assumptions.
Increases in the costs of pension benefits may continue and negatively affect our business as a result of: the effect of potential declines in the stock and bond markets on the performance of our pension plan assets; potential reductions in the discount rate used to determine the present value of our benefit obligations; and changes to our investment strategy that may impact our expected return on pension plan assets assumptions. U.S. generally accepted accounting principles require that we calculate income or expense for the plans using actuarial valuations. These valuations reflect assumptions about financial markets and interest rates, which may change based on economic conditions. Our accounting policy for defined benefit plans may subject earnings to volatility due to the recognition of actuarial gains and losses, particularly due to the change in the fair value of pension assets and interest rates. Funding requirements for our U.S. pension plans may become more significant. However, the ultimate amounts to be contributed are dependent upon, among other things, interest rates, underlying asset returns and the impact of legislative or regulatory changes related to pension funding obligations.
8
Future tax law changes or the interpretation of existing tax laws may materially impact our effective income tax rate, the resolution of unrecognized tax benefits and cash tax payments.
Our businesses are subject to income taxation in the U.S., as well as internationally. We are routinely audited by income tax authorities in many jurisdictions. Although we believe that the recorded tax estimates are reasonable and appropriate, there are significant uncertainties in these estimates. As a result, the ultimate outcome from any audit could be materially different from amounts reflected in our income tax provisions and accruals. Future settlements of income tax audits may have a material adverse effect on earnings between the period of initial recognition of tax estimates in our financial statements and the point of ultimate tax audit settlement. In addition, significant judgement is required in determining our provision for income taxes. Our total income tax expense could be affected by changes in tax laws rates in the jurisdictions in which our businesses are subject to taxation, changes in the valuation of deferred tax assets and liabilities or changes in tax laws or the interpretation of such laws by tax authorities.
Potential liabilities and costs from claims and litigation could adversely affect our results of operations, cash flows and financial condition.
We are, from time to time, involved in various claims, litigation matters and regulatory proceedings that arise in the ordinary course of our business and that could have an adverse effect on us. These matters may include contract disputes, intellectual property disputes, product recalls, personal injury claims, construction defects and home warranty claims, warranty disputes, environmental claims or proceedings, other tort claims, employment and tax matters and other proceedings and litigation, including class actions. It is not possible to predict the outcome of pending or future litigation, and, as with any litigation, it is possible that some of the actions could be decided unfavorably and could have an adverse effect on our results of operations, cash flows and financial condition.
We are subject to product safety regulations, recalls and direct claims for product liability that can result in significant liability and, regardless of the ultimate outcome, can be costly to defend. As a result of the difficulty of controlling the quality of products or components sourced from other manufacturers, we are exposed to risks relating to the quality of such products and to limitations on our recourse against such suppliers.
There can be no assurance that we will have access to the capital markets on terms acceptable to us.
From time to time we may need to access the long-term and short-term capital markets to obtain financing. Although we believe that the sources of capital currently in place permit us to finance our operations for the foreseeable future on acceptable terms and conditions, our access to, and the availability of, financing on acceptable terms and conditions in the future will be impacted by many factors, including, but not limited to: our financial performance, our credit ratings, reference rate reform, the liquidity of the overall capital markets and the state of the economy, including the U.S. housing market. There can be no assurance that we will have access to the capital markets on terms acceptable to us. In addition, a prolonged global economic downturn may also adversely impact our access to long-term capital markets, result in increased interest rates on our corporate debt, and weaken operating cash flow and liquidity. Decreased cash flow and liquidity could potentially adversely impact our ability to pay dividends, fund acquisitions and repurchase shares in the future.
Item 1B. Unresolved Staff Comments.
None.
Item 2. Properties.
Our principal executive office is located in Deerfield, Illinois. We operate 29 U.S. manufacturing facilities in 16 states and have 21 manufacturing facilities in international locations (8 in Mexico, 3 in Asia, 4 in Europe, 4 in Africa, and 2 in Canada). In addition, we have 51 distribution centers and warehouses worldwide, of which 40 are leased. The following table provides additional information with respect to these properties.
|
Segment |
|
Manufacturing Facilities |
|
|
|
Distribution Centers and Warehouses |
|
||||||||||||||||||
|
|
|
Owned |
|
|
Leased |
|
|
Total |
|
|
|
Owned |
|
|
Leased |
|
|
Total |
|
||||||
|
Cabinets |
|
|
21 |
|
|
|
3 |
|
|
|
24 |
|
|
|
|
3 |
|
|
|
15 |
|
|
|
18 |
|
|
Plumbing |
|
|
7 |
|
|
|
6 |
|
|
|
13 |
|
|
|
|
7 |
|
|
|
15 |
|
|
|
22 |
|
|
Doors & Security |
|
|
11 |
|
|
|
2 |
|
|
|
13 |
|
|
|
|
1 |
|
|
|
10 |
|
|
|
11 |
|
|
Totals |
|
|
39 |
|
|
|
11 |
|
|
|
50 |
|
|
|
|
11 |
|
|
|
40 |
|
|
|
51 |
|
We are of the opinion that the properties are suitable to our respective businesses and have production capacities adequate to meet the current needs of our businesses.
9
Item 3. Legal Proceedings.
The Company is a defendant in lawsuits that are ordinary routine litigation matters incidental to its businesses. It is not possible to predict the outcome of the pending actions, and, as with any litigation, it is possible that these actions could be decided unfavorably to the Company. The Company believes that there are meritorious defenses to these actions and that these actions will not have a material adverse effect upon the Company’s results of operations, cash flows or financial condition, and, where appropriate, these actions are being vigorously contested. Accordingly, the Company believes the likelihood of material loss is remote.
Item 4. Mine Safety Disclosures.
Not applicable.
Information about our Executive Officers.
Our current executive officers are as follows:
|
Name |
|
Age |
|
Position |
|
Christopher J. Klein |
|
56 |
|
Executive Chairman of the Board |
|
Nicholas I. Fink |
|
45 |
|
Chief Executive Officer |
|
Patrick D. Hallinan |
|
52 |
|
Senior Vice President and Chief Financial Officer |
|
Cheri M. Phyfer |
|
48 |
|
President, Plumbing |
|
Brett E. Finley |
|
49 |
|
President, Doors & Security |
|
R. David Banyard, Jr. |
|
51 |
|
President, Cabinets |
|
John D. Lee |
|
47 |
|
Senior Vice President, Global Growth and Development |
|
Robert K. Biggart |
|
65 |
|
Senior Vice President, General Counsel and Secretary |
|
Sheri R. Grissom |
|
55 |
|
Senior Vice President, Chief Human Resources Officer |
|
Brian C. Lantz |
|
57 |
|
Senior Vice President, Communications & Corporate Administration |
|
Marty Thomas |
|
61 |
|
Senior Vice President, Operations & Supply Chain Strategy |
|
Dan Luburic |
|
48 |
|
Vice President and Corporate Controller |
Christopher J. Klein has served as Executive Chairman of the Board of Directors since January 2020. From January 2010 through January 2020, Mr. Klein served as Chief Executive Officer of Fortune Brands.
Nicholas I. Fink has served as Chief Executive Officer since January 2020. From March 2019 to January 2020, Mr. Fink served as President and Chief Operating Officer of Fortune Brands. From July 2016 to March 2019, Mr. Fink served as President of the Company’s Plumbing business. From June 2015 to July 2016, Mr. Fink served as Senior Vice President of Global Growth and Development of Fortune Brands. Prior to that Mr. Fink served as President, Asia Pacific and South America of Beam Suntory, Inc., a global spirits company.
Patrick D. Hallinan has served as Senior Vice President and Chief Financial Officer of Fortune Brands since July 2017. From January 2017 to July 2017, Mr. Hallinan served as Senior Vice President of Finance of Fortune Brands. Mr. Hallinan served as chief financial officer of Moen Incorporated, a subsidiary of Fortune Brands, from November 2013 to January 2017.
Cheri M. Phyfer has served as President of the Plumbing segment since March 2019. Ms. Phyfer served as President of Moen’s U.S. business from 2018 to March 2019. Prior to that, Ms. Phyfer held various positions at the Sherwin-Williams Company, a manufacturer of paint, coatings, and related products, including President of the Consumer Brands Group (2017) and President & General Manager – Diversified Brands from 2013 to 2017.
Brett E. Finley has served as President of the Doors & Security segment since July 2018. From February 2016 to July 2018, Mr. Finley served as the President of Fortune Brands Doors, Inc. From February 2008 to February 2016, Mr. Finley held various leadership positions at IDEX Corporation, a global manufacturer of fluidics systems and specialty engineered products, including Senior Vice President, Group Executive, Fluid & Metering Technologies Segment and President - IDEX-Asia.
R. David Banyard, Jr. has served as President of the Cabinets segment since November 2019. Mr. Banyard served as President and Chief Executive Officer of Myer Industries, an international manufacturer of packaging, storage, and safety products and specialty molding, from December 2015 to October 2019. Prior to that, Mr. Banyard was the Group President of Fluid Handling Technologies at Roper Industries from 2010 to 2015.
10
John D. Lee has served as Senior Vice President of Global Growth and Development of Fortune Brands since January 2020. Mr. Lee served as Senior Vice President of Global Growth and Development of the Plumbing segment from July 2016 to January 2020. Prior to that he served as Vice President and Head of Strategy, Americas of Beam Suntory, Inc. from January 2015 to July 2016.
Robert K. Biggart has served as Senior Vice President, General Counsel and Secretary of Fortune Brands since December 2013.
Sheri R. Grissom has served as Senior Vice President, Chief Human Resources Officer since January 2020 and as Senior Vice President - Human Resources of Fortune Brands since February 2015. Prior to that, Ms. Grissom served as Executive Vice President - Global Human Resources of Actuant Corporation, a diversified industrial company.
Brian C. Lantz has served as Senior Vice President, Communications & Corporate Administration since January 2017. Mr. Lantz served as Vice President of Investor Relations and Corporate Communications from July 2013 to December 2016. Mr. Lantz joined Fortune Brands in June 2011 as Vice President of Investor Relations.
Marty Thomas has served as Senior Vice President, Operations and Supply Chain Strategy since September 2017. Mr. Thomas served as Senior Vice President of Global Operations and Engineering Services at Rockwell Automation, Inc., a provider of industrial automation and information products, from 2006 to 2016.
Dan Luburic has served as Vice President and Corporate Controller of Fortune Brands since October 2011.
PART II
Item 5. Market for Registrant’s Common Equity, Related Stockholder Matters and Issuer Purchases of Equity Securities.
Market Information, Dividends and Holders of Record
Our common stock is listed on the New York Stock Exchange (the “NYSE”) under the ticker symbol “FBHS”.
In December 2019, our Board of Directors increased the quarterly cash dividend by 9% to $0.24 per share of our common stock. Our Board of Directors will continue to evaluate dividend payment opportunities on a quarterly basis. There can be no assurance as to when and if future dividends will be paid, or at what level, because the payment of dividends is dependent upon our financial condition, results of operations, capital requirements and other factors deemed relevant by our Board of Directors.
On February 7, 2020, there were 9,216 record holders of the Company’s common stock, par value $0.01 per share. A substantially greater number of holders of the Company’s common stock are “street name” or beneficial holders, whose shares of record are held by banks, brokers or other financial institutions.
Purchases of Equity Securities by the Issuer and Affiliated Purchasers
Below are the repurchases of common stock by the Company or any “affiliated purchaser” (as defined in Rule 10b-18(a)(3) under the Exchange Act) for the three months ended December 31, 2019:
|
Three Months Ended December 31, 2019 |
|
Total number of shares purchased(a) |
|
|
|
Average price paid per share |
|
|
|
Total number of shares purchased as part of publicly announced plans or programs(a) |
|
|
|
Approximate dollar value of shares that may yet be purchased under the plans or programs(a) |
|
||||
|
October 1 – October 31 |
|
|
— |
|
|
|
$ |
— |
|
|
|
|
— |
|
|
|
$ |
313,749,831 |
|
|
November 1 – November 30 |
|
|
— |
|
|
|
|
— |
|
|
|
|
— |
|
|
|
|
313,749,831 |
|
|
December 1 – December 31 |
|
|
— |
|
|
|
|
— |
|
|
|
|
— |
|
|
|
|
313,749,831 |
|
|
Total |
|
|
— |
|
|
|
$ |
— |
|
|
|
|
— |
|
|
|
|
|
|
|
(a) |
Information on the Company’s share repurchase program follows: |
|
Authorization date |
|
Announcement date |
|
Authorization amount of shares of outstanding common stock |
|
Expiration date |
|
July 13, 2018 |
|
July 16, 2018 |
|
$400 million |
|
July 13, 2020 |
|
|
|
|
|
|
|
|
11
Stock Performance
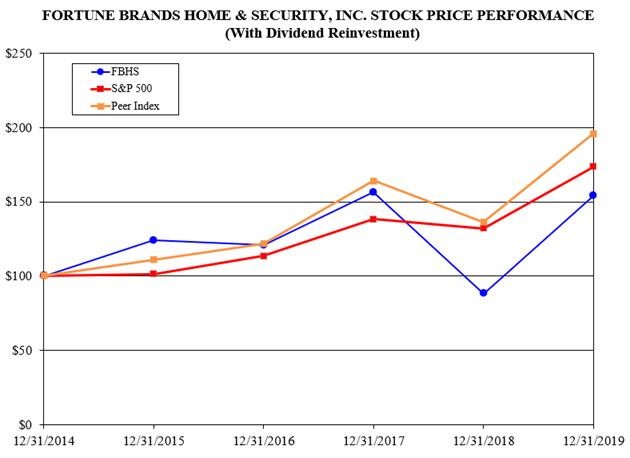
The above graph compares the relative performance of our common stock, the S&P 500 Index and a Peer Group Index. This graph covers the period from December 31, 2014 through December 31, 2019. This graph assumes $100 was invested in the stock or the index on December 31, 2014 and also assumes the reinvestment of dividends. The foregoing performance graph is being furnished as part of this Annual Report on Form 10-K solely in accordance with the requirement under Rule 14a-3(b)(9) to furnish our stockholders with such information, and therefore, shall not be deemed to be filed or incorporated by reference into any filings by the Company under the Securities Act or the Exchange Act.
Peer Group Index. The 2019 peer group is composed of the following publicly traded companies corresponding to the Company’s core businesses:
American Woodmark Corporation, Armstrong World Industries, Inc., Leggett & Platt Incorporated, Lennox International Inc., Masco Corporation, Masonite International Corporation, Mohawk Industries, Inc., Newell Brands Inc., The Sherwin-Williams Company, Stanley Black & Decker, Inc. and Fastenal Company. USG Corporation was removed from the 2019 peer group as it was acquired by Gebr. Knauf KG during 2019 and its shares are no longer publicly traded. American Woodmark Corporation and Masonite International Corporation were added to the 2019 peer group as they correspond to our core businesses.
Calculation of Peer Group Index
The weighted-average total return of the entire peer group, for the period of December 31, 2014 through December 31, 2019, is calculated in the following manner:
|
|
(1) |
the total return of each peer group member is calculated by dividing the change in market value of a share of its common stock during the period, assuming reinvestment of any dividends, by the value of a share of its common stock at the beginning of the period; and |
|
|
(2) |
each peer group member’s total return is then weighted within the index based on its market capitalization relative to the market capitalization of the entire index, and the sum of such weighted returns results in a weighted-average total return for the entire Peer Group Index. |
12
Item 6. Selected Financial Data.
Five-year Consolidated Selected Financial Data
|
|
|
Years Ended December 31, |
|
||||||||||||||||||
|
(In millions, except per share amounts) |
|
2019 |
|
|
|
2018 |
|
|
2017 |
|
|
2016 |
|
|
2015 |
|
|||||
|
Income statement data(a)(e) |
|
|
|
|
|
|
|
|
|
|
|
|
|
|
|
|
|
|
|
|
|
|
Net sales |
|
$ |
5,764.6 |
|
|
|
$ |
5,485.1 |
|
|
$ |
5,283.3 |
|
|
$ |
4,984.9 |
|
|
$ |
4,579.4 |
|
|
Cost of products sold |
|
|
3,712.2 |
|
|
|
|
3,525.7 |
|
|
|
3,358.3 |
|
|
|
3,188.8 |
|
|
|
3,001.1 |
|
|
Selling, general and administrative expenses |
|
|
1,256.3 |
|
|
|
|
1,241.4 |
|
|
|
1,196.9 |
|
|
|
1,135.5 |
|
|
|
1,059.8 |
|
|
Amortization of intangible assets |
|
|
41.4 |
|
|
|
|
36.1 |
|
|
|
31.7 |
|
|
|
28.1 |
|
|
|
21.6 |
|
|
Loss on sale of product line (see Note 4) |
|
|
— |
|
|
|
|
— |
|
|
|
2.4 |
|
|
|
— |
|
|
|
— |
|
|
Asset impairment charges |
|
|
41.5 |
|
|
|
|
62.6 |
|
|
|
3.2 |
|
|
|
— |
|
|
|
— |
|
|
Restructuring charges |
|
|
14.7 |
|
|
|
|
24.1 |
|
|
|
8.3 |
|
|
|
13.9 |
|
|
|
16.6 |
|
|
Operating income |
|
|
698.5 |
|
|
|
|
595.2 |
|
|
|
682.5 |
|
|
|
618.6 |
|
|
|
480.3 |
|
|
Income from continuing operations, net of tax(b)(c) |
|
|
431.3 |
|
|
|
|
390.0 |
|
|
|
475.3 |
|
|
|
412.4 |
|
|
|
306.5 |
|
|
Basic earnings per share – continuing operations |
|
|
3.09 |
|
|
|
|
2.69 |
|
|
|
3.10 |
|
|
|
2.67 |
|
|
|
1.92 |
|
|
Diluted earnings per share – continuing operations |
|
|
3.06 |
|
|
|
|
2.66 |
|
|
|
3.05 |
|
|
|
2.61 |
|
|
|
1.88 |
|
|
Other data(a)(e) |
|
|
|
|
|
|
|
|
|
|
|
|
|
|
|
|
|
|
|
|
|
|
Depreciation and amortization |
|
$ |
152.7 |
|
|
|
$ |
149.6 |
|
|
$ |
130.3 |
|
|
$ |
122.7 |
|
|
$ |
115.1 |
|
|
Cash flow provided by operating activities |
|
|
637.2 |
|
|
|
|
604.0 |
|
|
|
600.3 |
|
|
|
650.5 |
|
|
|
429.2 |
|
|
Capital expenditures |
|
|
(131.8 |
) |
|
|
|
(150.1 |
) |
|
|
(165.0 |
) |
|
|
(149.3 |
) |
|
|
(128.5 |
) |
|
Proceeds from the disposition of assets |
|
|
4.2 |
|
|
|
|
6.1 |
|
|
|
0.4 |
|
|
|
3.9 |
|
|
|
2.5 |
|
|
Dividends declared per common share |
|
|
0.90 |
|
|
|
|
0.82 |
|
|
|
0.74 |
|
|
|
0.66 |
|
|
|
0.58 |
|
|
Balance sheet data(e) |
|
|
|
|
|
|
|
|
|
|
|
|
|
|
|
|
|
|
|
|
|
|
Total assets(c)(d) |
|
$ |
6,291.3 |
|
|
|
$ |
5,964.6 |
|
|
$ |
5,511.4 |
|
|
$ |
5,128.5 |
|
|
$ |
4,875.7 |
|
|
Total third party debt(c) |
|
|
2,184.3 |
|
|
|
|
2,334.0 |
|
|
|
1,507.6 |
|
|
|
1,431.1 |
|
|
|
1,168.7 |
|
|
Total invested capital |
|
|
4,612.0 |
|
|
|
|
4,513.9 |
|
|
|
4,108.7 |
|
|
|
3,794.1 |
|
|
|
3,623.3 |
|
|
(a) |
Income statement data excludes discontinued operations. Other data is derived from the Statement of Cash Flows and therefore includes discontinued operations. For additional information, refer to Note 20, “Information on Business Segments.” |
|
(b) |
The Company’s defined benefit expense included recognition of pre-tax actuarial gains (losses) in each of the last five years as follows: |
|
|
|
2019 |
|
|
|
2018 |
|
|
2017 |
|
|
2016 |
|
|
2015 |
|
|||||
|
Pre-tax actuarial (losses) gains |
|
$ |
(34.1 |
) |
|
|
$ |
(3.8 |
) |
|
$ |
0.5 |
|
|
$ |
(1.9 |
) |
|
$ |
(8.6 |
) |
|
Portion in other (expense) income |
|
|
(34.1 |
) |
|
|
|
(3.8 |
) |
|
|
0.5 |
|
|
|
(1.9 |
) |
|
|
(2.5 |
) |
|
Portion in discontinued operations |
|
|
— |
|
|
|
|
— |
|
|
|
— |
|
|
|
— |
|
|
|
(6.1 |
) |
|
(c) |
Includes an estimated net tax benefit of $25.7 million in 2017 resulting from the enactment of the U.S. Tax Cuts and Jobs Act of 2017 on December 22, 2017 (the “Tax Act”). During 2018, the Company completed its SAB 118 analysis with respect to income tax effects of the Tax Act. As a result, the Company recorded a tax expense in the amount of $5.5 million in 2018. |
|
(d) |
Includes operating lease right-of-use assets of $165.6 million as of 2019 resulting from the adoption of ASU 2016-02 “Leases.” Prior periods were not retrospectively adjusted to reflect the impact of this standard. |
|
(e) |
Fiberon’s results of operations are included in the income statement data and other data from September 2018 (date of acquisition) and included in the balance sheet data beginning as of 2018. |
13
Item 7. Management’s Discussion and Analysis of Financial Condition and Results of Operations.
Introduction
This Management’s Discussion and Analysis of Financial Condition and Results of Operations (“MD&A”) is a supplement to the accompanying consolidated financial statements and provides additional information on our business, recent developments, financial condition, liquidity and capital resources, cash flows and results of operations. MD&A is organized as follows:
|
• |
Overview: This section provides a general description of our business, and a discussion of management’s general outlook regarding market demand, our competitive position and product innovation, as well as recent developments we believe are important to understanding our results of operations and financial condition or in understanding anticipated future trends. |
|
• |
Basis of Presentation: This section provides a discussion of the basis on which our consolidated financial statements were prepared. |
|
• |
Results of Operations: This section provides an analysis of our results of operations for the two years ended December 31, 2019 and 2018. For a discussion of our 2017 results, please refer to Item 7. “Management’s Discussion and Analysis” of the Company’s Annual Report on Form 10-K for the year ended December 31, 2018 filed with the SEC on February 25, 2019. |
|
• |
Liquidity and Capital Resources: This section provides a discussion of our financial condition and an analysis of our cash flows for each of the two years ended December 31, 2019 and 2018. This section also provides a discussion of our contractual obligations, other purchase commitments and customer credit risk that existed at December 31, 2019, as well as a discussion of our ability to fund our future commitments and ongoing operating activities through internal and external sources of capital. |
|
• |
Critical Accounting Policies and Estimates: This section identifies and summarizes those accounting policies that significantly impact our reported results of operations and financial condition and require significant judgment or estimates on the part of management in their application. |
Overview
The Company is a leader in home and security products focused on the design, manufacture and sale of market-leading branded products in the following categories: kitchen and bath cabinetry, plumbing and accessories, entry door systems, security products and outdoor performance materials used in decking and railing products.
For the year ended December 31, 2019, net sales based on country of destination were:
|
(In millions) |
|
|
|
|
|
|
|
|
|
United States |
|
$ |
4,823.9 |
|
|
|
84 |
% |
|
Canada |
|
|
401.0 |
|
|
7 |
|
|
|
China |
|
|
355.4 |
|
|
6 |
|
|
|
Other international |
|
|
184.3 |
|
|
3 |
|
|
|
Total |
|
$ |
5,764.6 |
|
|
|
100 |
% |
We believe the Company has certain competitive advantages including market-leading brands, a diversified mix of customer channels, lean and flexible supply chains, a decentralized business model and a strong capital structure, as well as a tradition of strong innovation and customer service. We are focused on outperforming our markets in growth, profitability and returns in order to drive increased shareholder value. We believe the Company’s track record reflects the long-term attractiveness and potential of our categories and our leading brands. As consumer demand and the housing market continue to grow, we expect the benefits of operating leverage and strategic spending to support increased manufacturing capacity and long-term growth initiatives will help us to continue to achieve profitable organic growth.
We continue to believe our most attractive opportunities are to invest in profitable organic growth initiatives, pursue accretive strategic acquisitions, non-controlling equity investments, and joint ventures, and return cash to stockholders through a combination of dividends and repurchases of shares of our common stock under our share repurchase program as explained in further detail under “Liquidity and Capital Resources” below.
The U.S. market for our home products consists of spending on both new home construction and repair and remodel activities within existing homes, with the substantial majority of the markets we serve consisting of repair and remodel spending. Continued growth in the U.S. market for our home products will largely depend on consumer confidence, employment, wage growth, home prices, stable mortgage rates and credit availability.
14
We may be impacted by fluctuations in raw materials, tariffs, transportation costs, foreign exchange rates and promotional activity among our competitors. We strive to offset the potential unfavorable impact of these items with productivity improvements and price increases.
During the two years ended December 31, 2019, our net sales grew at a compounded annual rate of 4.5% as we benefited from a growing U.S. home products market, acquisitions, and growth in international markets. Operating income grew at a compounded annual rate of 1.2% with consolidated operating margins between 11% and 13% from 2017 to 2019. Growth in operating income was primarily due to higher sales volume, changes to our portfolio of businesses, control over our operating expenses and the benefits of productivity programs.
During 2019, the U.S. home products market grew due to increases in repair and remodel and new home construction activity. We believe spending for home repair and remodeling increased approximately 3% to 4% and new housing construction experienced approximately 2% growth in 2019 compared to 2018. In 2019, net sales grew 5.1% due to price increases to help mitigate cumulative raw material cost increases, including the impact of higher tariffs, the benefit from the 2018 Fiberon acquisition in our Doors & Security segment ($139 million), and higher sales volume, including growth in China. These benefits were partially offset by lower sales unit volume of make-to-order custom and semi-custom cabinetry products, unfavorable promotion and rebate costs, and unfavorable foreign exchange of $29 million. In 2019, operating income increased 17.4% over 2018 due to higher net sales, productivity improvements, and lower restructuring and asset impairment charges. These benefits were partially offset by higher commodity costs, including the impact of higher tariffs, unfavorable mix and higher employee related costs.
In September 2019, we issued $700 million of unsecured senior notes (“2019 Notes”) in a registered public offering. The 2019 Notes are due in 2029 with a coupon rate of 3.25%. The Company used the proceeds from the 2019 Notes offering to repay in full the Company’s $350 million term loan and to pay down outstanding balances under our revolving credit facility.
During the fourth quarter of 2018, our Plumbing segment entered into strategic partnerships with several companies who incorporate technology into plumbing-related products, and at the same time acquired non-controlling equity interests in two of our partners. This includes an investment in Flo Technologies, Inc.
In September 2018, we issued $600 million of unsecured senior notes (“2018 Notes”) in a registered public offering. The 2018 Notes are due in 2023 with a coupon rate of 4%. We used the proceeds from the 2018 Notes offering to pay down our revolving credit facility.
In September 2018, we acquired 100% of the membership interests of Fiber Composites LLC (“Fiberon”), a leading U.S. manufacturer of outdoor performance materials used in decking and railing products for a total purchase price of approximately $470.0 million, subject to certain post-closing adjustments. The acquisition of Fiberon provides category expansion and product extension opportunities into the outdoor living space for our Doors & Security segment. We financed the transaction using cash on hand and borrowings under our revolving credit and term loan facilities. Fiberon’s results of operations are included in the Doors & Security segment from the date of acquisition.
Basis of Presentation
|
The consolidated financial statements in this Annual Report on Form 10-K have been derived from the accounts of the Company and its wholly-owned subsidiaries. The Company’s consolidated financial statements are based on a fiscal year ending December 31. Certain of the Company’s subsidiaries operate on a 52 or 53 week fiscal year ending during the month of December. |
|
In September 2018, we acquired Fiberon. The financial results of Fiberon were included in the Company’s consolidated statements of income and statements of cash flow beginning in September 2018 and the consolidated balance sheet as of December 31, 2018. The results of operations are included in the Doors & Security segment. |
Results of Operations
The following discussion of both consolidated results of operations and segment results of operations refers to the year ended December 31, 2019 compared to the year ended December 31, 2018. The discussion of consolidated results of operations should be read in conjunction with the discussion of segment results of operations and our financial statements and notes thereto included in this Annual Report on Form 10-K. Unless otherwise noted, all discussion of results of operations are for continuing operations.
15
Years Ended December 31, 2019 and 2018
|
(In millions) |
|
2019 |
|
|
% change |
|
|
|
2018 |
|
|
|||
|
Net Sales: |
|
|
|
|
|
|
|
|
|
|
|
|
|
|
|
Cabinets |
|
$ |
2,388.5 |
|
|
|
(1.2 |
)% |
|
|
$ |
2,418.6 |
|
|
|
Plumbing |
|
|
2,027.2 |
|
|
|
7.6 |
|
|
|
|
1,883.3 |
|
|
|
Doors & Security |
|
|
1,348.9 |
|
|
|
14.0 |
|
|
|
|
1,183.2 |
|
|
|
Total Fortune Brands |
|
$ |
5,764.6 |
|
|
|
5.1 |
% |
|
|
$ |
5,485.1 |
|
|
|
Operating Income: |
|
|
|
|
|
|
|
|
|
|
|
|
|
|
|
Cabinets |
|
$ |
178.3 |
|
|
|
24.3 |
% |
|
|
$ |
143.5 |
|
|
|
Plumbing |
|
|
427.6 |
|
|
|
13.9 |
|
|
|
|
375.3 |
|
|
|
Doors & Security |
|
|
172.3 |
|
|
|
10.7 |
|
|
|
|
155.6 |
|
|
|
Corporate |
|
|
(79.7 |
) |
|
|
(0.6 |
) |
|
|
|
(79.2 |
) |
|
|
Total Fortune Brands |
|
$ |
698.5 |
|
|
|
17.4 |
% |
|
|
$ |
595.2 |
|
|
Certain items had a significant impact on our results in 2019 and 2018. These included the acquisition of Fiberon, restructuring and other charges, asset impairment charges and the impact of changes in foreign currency exchange rates.
In 2019, financial results included:
|
• |
asset impairment charges of $41.5 related to impairment of two indefinite-lived tradenames within our Cabinets segment, which were primarily the result of a continuing shift in consumer demand from custom and semi-custom cabinetry products to value-priced cabinetry products, which led to reductions in future growth rates related to these tradenames, |
|
• |
actuarial losses within our defined benefit plans of $34.7 million primarily related to decreases in discount rates and differences between expected and actual returns on plan assets, |
|
• |
restructuring and other charges of $22.2 million before tax ($16.8 million after tax), primarily related to severance costs within all of our segments and costs associated with closing facilities within our Plumbing and Doors & Security segments, |
|
• |
the benefit of the Fiberon acquisition in our Doors & Security segment and |
|
• |
the impact of foreign exchange primarily due to movement in the Canadian Dollar, British Pound, Mexican Peso and Chinese Yuan, which had an unfavorable impact compared to 2018, of approximately $29 million on net sales, approximately $10 million on operating income and approximately $8 million on net income. |
In 2018, financial results included:
|
• |
the addition of the Fiberon acquisition in our Doors & Security segment, |
|
• |
asset impairment charges of $62.6 related to impairment of two indefinite-lived tradenames within our Cabinets segment, which were primarily the result of changes in the mix of revenue across our tradenames finalized during our annual planning process conducted during the fourth quarter, as well as restructuring actions announced during the third quarter, |
|
• |
restructuring and other charges of $35.4 million before tax ($26.9 million after tax), primarily related to costs associated with our initiatives to consolidate our manufacturing footprint and product lines in our Cabinets segment and severance costs within all of our segments, |
|
• |
the impact of foreign exchange primarily due to movement in the Canadian Dollar, British Pound, Mexican Peso and Chinese Yuan, which had a favorable impact compared to 2017, of approximately $9 million on net sales, approximately $6 million on operating income and approximately $6 million on net income, |
|
• |
the favorable impact of changes from last-in, first-out (“LIFO”) to first-in, first-out (“FIFO”) for product groups in which metals comprise a significant portion of inventory cost, which resulted in income of approximately $7.3 million before tax ($5.5 million after tax) and |
|
• |
during 2018, the Company completed its SAB 118 analysis with respect to income tax effects resulting from the enactment of the U.S. Tax Cuts and Jobs Act of 2017 on December 22, 2017 (the “Tax Act”). As a result, the Company recorded a tax expense in the amount of $5.5 million in 2018. |
Total Fortune Brands
Net sales
Net sales increased by $279.5 million, or 5.1%, due to price increases to help mitigate cumulative raw material cost increases, including the impact of higher tariffs, the full year benefit from the 2018 Fiberon acquisition in our Doors & Security segment ($139 million), and higher sales volume, including growth in China. These benefits were partially offset by lower sales unit volume of make-to-order custom and semi-custom cabinetry products, unfavorable promotion and rebate costs, and unfavorable foreign exchange of $29 million.
16
Cost of products sold
Cost of products sold increased by $186.5 million, or 5.3%, due to the higher net sales and increased commodity costs including the impact of higher tariffs, partially offset by the benefit from productivity improvements and lower amortization of acquisition-related inventory fair value adjustments in our Plumbing and Doors & Security segments ($8.6 million).
Selling, general and administrative expenses
Selling, general and administrative expenses increased by $14.9 million, or 1.2%, due to higher employee related costs and transportation costs, as well as the impact of expenses associated with the 2018 Fiberon acquisition in our Doors & Security segment.
Amortization of intangible assets
Amortization of intangible assets increased by $5.3 million due to the 2018 Fiberon acquisition in our Doors & Security segment.
Asset impairment charges
Asset impairment charges of $41.5 million and $62.6 million in 2019 and 2018, respectively related to three indefinite-lived tradenames within our Cabinets segment.
Restructuring charges
Restructuring charges of $14.7 million in 2019 primarily related to severance costs and costs associated with closing facilities across all of our segments. Restructuring charges of $24.1 million in 2018 primarily related to our initiatives to consolidate and rationalize our manufacturing footprint and discontinue certain product lines in our Cabinets segment and severance costs within all our segments.
Operating income
Operating income increased by $103.3 million, or 17.4%, primarily due to higher net sales, productivity improvements, and lower restructuring and asset impairment charges. These benefits were partially offset by higher commodity costs, including the impact of higher tariffs, unfavorable mix and higher employee related costs.
Interest expense
Interest expense increased by $19.7 million to $94.2 million, due to higher average borrowings and higher average interest rates.
Other expense (income), net
Other expense (income), net, was expense of $29.0 million in 2019, compared to income of $16.3 million in 2018. The increase of $45.3 million of expense is primarily due to higher actuarial losses within our defined benefit plans in 2019 ($30.3 million increase), the absence of the hedge gains associated with our September 2018 debt issuance and unfavorable foreign currency adjustments.
Income taxes
The effective income tax rates for 2019 and 2018 were 25.0% and 27.4%, respectively. The 2019 effective income tax rate was favorably impacted by a tax benefit related to share-based compensation ($3.7 million), and unfavorably impacted by a valuation allowance increase ($3.4 million), state and local taxes ($18.0 million), unfavorable tax rates in foreign jurisdictions ($1.4 million), and increases in uncertain tax positions ($7.5 million).
The 2018 effective income tax rate was favorably impacted by a tax benefit related to share-based compensation ($2.1 million) and unfavorably impacted by a valuation allowance increase ($3.0 million), an adjustment to the provisional net benefit recorded in 2017 under the Tax Act ($5.5 million), state and local taxes ($13.7 million), unfavorable tax rates in foreign jurisdictions ($3.5 million), and increases in uncertain tax positions ($4.1 million).
Net income from continuing operations
Net income from continuing operations was $431.3 million in 2019 compared to $390.0 million in 2018. The increase of $41.3 million was due to higher operating income and lower income tax expenses, partly offset by higher other expense and interest expense.
17
Results By Segment
Cabinets
Net sales decreased by $30.1 million, or 1.2%, predominantly due to lower sales unit volume of make-to-order custom and semi-custom cabinetry products, lower sales in Canada and increased promotional costs. Foreign exchange was unfavorable by approximately $3 million. These factors were partly offset by benefits from price increases to help mitigate cumulative raw material cost increases and higher sales unit volume of stock cabinetry products.
Operating income increased by $34.8 million, or 24.3%, due to price increases to help mitigate cumulative raw material cost increases, the benefit from productivity improvements, lower asset impairment charges, lower restructuring and other charges and higher sales unit volume of stock cabinetry products. These benefits were partly offset by higher employee related costs, lower sales unit volume of make-to-order custom and semi-custom cabinetry products, and commodity cost inflation.
Plumbing
Net sales increased by $143.9 million, or 7.6%, due to higher sales volume, including growth in China, and price increases to help mitigate tariffs. These benefits were partially offset by lower sales volume in Canada, Mexico and luxury-branded products and higher rebate costs as well as unfavorable foreign exchange of approximately $22 million.
Operating income increased by $52.3 million, or 13.9%, due to higher net sales, the benefit from productivity improvements and the absence in 2019 of the amortization of the acquisition-related inventory fair value adjustment ($5.5 million of expense in 2018) related to our Victoria+Albert acquisition. These benefits were partially offset by the impact of higher tariffs, unfavorable mix and higher rebate costs. Foreign exchange was unfavorable by approximately $11 million.
Doors & Security
Net sales increased by $165.7 million, or 14.0%, due to the full year benefit from the 2018 Fiberon acquisition ($139 million), price increases to help mitigate tariffs and cumulative raw material cost increases and new customers in decking products. These benefits were partially offset by lower sales unit volume of doors products due to inventory rebalancing in the retail distribution channel. Foreign exchange was unfavorable by approximately $4 million.
Operating income increased by $16.7 million, or 10.7%, due to higher net sales including the full year benefit from the 2018 Fiberon acquisition and lower amortization of the acquisition-related inventory fair value adjustment related to Fiberon ($3.0 million decrease in 2019). These factors were partially offset by commodity cost inflation, an inventory valuation accounting change benefit in 2018 of $12.8 million, unfavorable product mix and an expense due to a fair value adjustment associated with an idle manufacturing facility ($1.7 million in 2019).
Corporate
Corporate expenses increased by $0.5 million, or 0.6%, due to higher employee related costs.
Liquidity and Capital Resources
Our principal sources of liquidity are cash on hand, cash flows from operating activities, cash borrowed under our credit facility and cash from debt issuances in the capital markets. Our operating income is generated by our subsidiaries. We believe our operating cash flows, including funds available under the credit facility and access to capital markets, provide sufficient liquidity to support the Company’s liquidity and financing needs, which are working capital requirements, capital expenditures and service of indebtedness, as well as to finance acquisitions, repurchase shares of our common stock and pay dividends to stockholders, as the Board of Directors deems appropriate.
Our cash flows from operations, borrowing availability and overall liquidity are subject to certain risks and uncertainties, including those described in the section entitled “Item 1A. Risk Factors.” In addition, we cannot predict whether or when we may enter into acquisitions, joint ventures or dispositions, make any purchases of shares of our common stock under our share repurchase programs, or pay dividends, or what impact any such transactions could have on our results of operations, cash flows or financial condition, whether as a result of the issuance of debt or equity securities, or otherwise.
18
Unsecured Senior Notes
At December 31, 2019, the Company had aggregate outstanding notes in the principal amount of $2.2 billion, with varying maturities (the “Notes”). The Notes are unsecured senior obligations of the Company. The following table provides a summary of the Company’s outstanding Notes, including the carrying value of the Notes, net of underwriting commissions, price discounts and debt issuance costs as of December 31, 2019 and December 31, 2018:
|
(in millions) |
|
|
|
|
|
|
|
|
Net Carrying Value |
|
|||||
|
Coupon Rate |
Principal Amount |
|
|
Issuance Date |
|
Maturity Date |
|
December 31, 2019 |
|
|
December 31, 2018 |
|
|||
|
3.000% Senior Notes |
$ |
400.0 |
|
|
June 2015 |
|
June 2020 |
|
$ |
399.7 |
|
|
$ |
399.0 |
|
|
4.000% Senior Notes |
|
500.0 |
|
|
June 2015 |
|
June 2025 |
|
|
495.8 |
|
|
|
495.0 |
|
|
4.000% Senior Notes (the “2018 Notes”) |
|
600.0 |
|
|
September 2018 |
|
September 2023 |
|
|
596.1 |
|
|
|
595.0 |
|
|
3.250% Senior Notes (the “2019 Notes”) |
|
700.0 |
|
|
September 2019 |
|
September 2029 |
|
|
692.7 |
|
|
|
— |
|
|
Total Senior Notes |
$ |
2,200.0 |
|
|
|
|
|
|
$ |
2,184.3 |
|
|
$ |
1,489.0 |
|
In September 2019, we issued $700 million of unsecured senior notes (“2019 Notes”) in a registered public offering. The 2019 Notes are due in 2029 with a coupon rate of 3.25%. The Company used the proceeds from the 2019 Notes offering to repay in full the Company’s $350 million term loan and to pay down outstanding balances under our revolving credit facility.
In September 2018, we issued $600 million of unsecured senior notes (“2018 Notes”) in a registered public offering. The 2018 Notes are due in 2023 with a coupon rate of 4%. We used the proceeds from the 2018 Notes offering to pay down our revolving credit facility.
As of December 31, 2019, Notes payments due during the next five years are $400 million in 2020, zero in 2021 through 2022 and $600 million in 2023 through 2024. The Company intends to repay or refinance the 3.000% Senior Notes on or before the June 2020 maturity date.
Credit Facilities
In September 2019, the Company entered into a second amended and restated $1.25 billion revolving credit facility (the “2019 Revolving Credit Agreement”), and borrowings thereunder will be used for general corporate purposes. The terms and conditions of the 2019 Revolving Credit Agreement, including the total commitment amount, essentially remained the same as the previous revolving credit facility, except that the maturity date was extended to September 2024. Interest rates under the 2019 Revolving Credit Agreement are variable based on LIBOR at the time of the borrowing and the Company’s long-term credit rating and can range from LIBOR + 0.91% to LIBOR + 1.4%. Borrowings amounting to $165.0 million were rolled over from the prior revolving credit facility into the 2019 Revolving Credit Agreement. The amendment also includes a covenant under which the Company is required to maintain a minimum ratio of consolidated EBITDA to consolidated interest expense of 3.0 to 1.0. Adjusted EBITDA is defined as consolidated net income before interest expense, income taxes, depreciation, amortization of intangible assets, losses from asset impairments, and certain other one-time adjustments. In addition, the amendment includes a covenant under which the Company’s ratio of consolidated debt minus certain cash and cash equivalents to consolidated EBITDA generally may not exceed 3.5 to 1.0. This amendment and restatement of the credit agreement was a non-cash transaction for the Company. On December 31, 2019 and December 31, 2018, our outstanding borrowings under this credit facility were zero and $320.0 million, respectively. As of December 31, 2019, we were in compliance with all covenants under this credit facility.
In September 2019, the Company used the proceeds from the 2019 Notes to repay the full outstanding balance on the Term Loan entered into in March 2018 and subsequently amended in August 2018 and March 2019 (the “Term Loan”). Following the March 2019 amendment, the Term Loan provided for borrowings of $350 million and was scheduled to mature in March 2020. At December 31, 2019 and December 31, 2018, amounts due under the Term Loan were zero and $525.0 million, respectively, which is included within Short-term debt in the consolidated balance sheets.
We currently have uncommitted bank lines of credit in China, which provide for unsecured borrowings for working capital of up to $17.5 million in aggregate as of December 31, 2019 and $23.5 million in aggregate as of December 31, 2018, of which zero was outstanding as of December 31, 2019 and 2018. The weighted-average interest rates on these borrowings were zero in 2019 and 2018.
19
The components of external long-term debt were as follows:
|
(In millions) |
|
2019 |
|
|
|
2018 |
|
||
|
Notes |
|
$ |
2,184.3 |
|
|
|
$ |
1,489.0 |
|
|
$1,250 million revolving credit agreement due September 2024 |
|
|
— |
|
|
|
|
320.0 |
|
|
Term Loan (due March 2020) |
|
|
— |
|
|
|
|
525.0 |
|
|
Total debt |
|
|
2,184.3 |
|
|
|
|
2,334.0 |
|
|
Less: current portion |
|
|
399.7 |
|
|
|
|
525.0 |
|
|
Total long-term debt |
|
$ |
1,784.6 |
|
|
|
$ |
1,809.0 |
|
In our debt agreements, there are normal and customary events of default which would permit the lenders to accelerate the debt if not cured within applicable grace periods, such as failure to pay principal or interest when due or a change in control of the Company. There were no events of default as of December 31, 2019.
Cash and Seasonality
In 2019, we invested approximately $58 million in incremental capacity to support long-term growth potential and new products. We expect capital spending in 2020 to be in the range of $160 to $175 million. On December 31, 2019, we had cash and cash equivalents of $387.9 million, of which $341.1 million was held at non-U.S. subsidiaries. We manage our global cash requirements considering (i) available funds among the subsidiaries through which we conduct business, (ii) the geographic location of our liquidity needs, and (iii) the cost to access international cash balances. The repatriation of non-U.S. cash balances from certain subsidiaries could have adverse tax consequences as we may be required to pay and record tax expense on those funds that are repatriated.
Our operating cash flows are significantly impacted by the seasonality of our business. We typically generate most of our operating cash flow in the third and fourth quarters of each year. We use operating cash in the first quarter of the year.
Share Repurchases
In 2019, we repurchased 2.0 million shares of our outstanding common stock under the Company’s share repurchase program for $100.0 million. As of December 31, 2019, the Company’s total remaining share repurchase authorization under the remaining program was approximately $314 million. The share repurchase program does not obligate the Company to repurchase any specific dollar amount or number of shares and may be suspended or discontinued at any time.
Dividends
In 2019, we paid dividends in the amount of $123.0 million to the Company’s shareholders. Our Board of Directors will continue to evaluate dividend payment opportunities on a quarterly basis. There can be no assurance as to when and if future dividends will be paid, and at what level, because the payment of dividends is dependent on our financial condition, results of operations, cash flows, capital requirements and other factors deemed relevant by our Board of Directors. There are no restrictions on the ability of our subsidiaries to pay dividends or make other distributions to Fortune Brands.
Acquisitions
We periodically review our portfolio of brands and evaluate potential strategic transactions and other capital initiatives to increase shareholder value. In September 2018, we acquired 100% of the membership interests of Fiberon, a leading U.S. manufacturer of outdoor performance materials used in decking and railing products, for a total purchase price of approximately $470 million, subject to certain post-closing adjustments. The acquisition of Fiberon provided category expansion and product extension opportunities into the outdoor living space for our Doors & Security segment. We financed the transaction using cash on hand and borrowings under our revolving credit and term loan facilities. The results of operations are included in the Doors & Security segment from the date of acquisition.
Cash Flows
Below is a summary of cash flows for the years ended December 31, 2019 and 2018.
|
(In millions) |
|
2019 |
|
|
|
2018 |
|
||
|
Net cash provided by operating activities |
|
$ |
637.2 |
|
|
|
$ |
604.0 |
|
|
Net cash used in investing activities |
|
|
(127.6 |
) |
|
|
|
(634.3 |
) |
|
Net cash used in financing activities |
|
|
(389.7 |
) |
|
|
|
(6.8 |
) |
|
Effect of foreign exchange rate changes on cash |
|
|
4.3 |
|
|
|
|
(15.2 |
) |
|
Net (decrease) increase in cash, cash equivalents and restricted cash |
|
$ |
124.2 |
|
|
|
$ |
(52.3 |
) |
20
Net cash provided by operating activities was $637.2 million in 2019 compared to $604.0 million in 2018. The $33.2 million increase in cash provided from 2018 to 2019 was primarily due to increases in net income and lower increases in inventories, partially offset by increases in accounts receivable balances and decreases in accrued taxes.
Net cash used in investing activities was $127.6 million in 2019 compared to $634.3 million in 2018. The decrease in cash used of $506.7 million from 2018 to 2019 was primarily due to a $465.6 million decrease in cost of acquisitions.
Net cash used by financing activities was $389.7 million in 2019 compared to $6.8 million in 2018. The increase in net cash used of $382.9 million from 2018 to 2019 was primarily due to net repayments of debt in 2019 compared to net borrowings in 2018 ($976.9 million increase), partly offset by lower share repurchases in 2019 compared to 2018 ($594.6 million decrease).
Pension Plans
Subsidiaries of Fortune Brands sponsor their respective defined benefit pension plans that are funded by a portfolio of investments maintained within our benefit plan trust. In 2019 and 2018, we contributed $10.0 million and $10.0 million, respectively, to our qualified pension plans. In 2020, we expect to make pension contributions of approximately $23.0 million. As of December 31, 2019, the fair value of our total pension plan assets was $677.2 million, representing funding of 77% of the accumulated benefit obligation liability. For the foreseeable future, we believe that we have sufficient liquidity to meet the minimum funding that may be required by the Pension Protection Act of 2006.
Foreign Exchange
We have operations in various foreign countries, principally Canada, China, Mexico, the United Kingdom, France, Australia and Japan. Therefore, changes in the value of the related currencies affect our financial statements when translated into U.S. dollars.
Contractual Obligations and Other Commercial Commitments
The following table describes other obligations and commitments to make future payments under contracts, such as debt and lease agreements, and under contingent commitments, such as debt guarantees, as of December 31, 2019.
|
(In millions) |
|
Payments Due by Period as of December 31, 2019 |
|
|||||||||||||||||
|
Contractual Obligations |
|
Total |
|
|
Less than 1 year |
|
|
1-3 years |
|
|
4-5 years |
|
|
After 5 years |
|
|||||
|
Short-term and long-term debt |
|
$ |
2,200.0 |
|
|
$ |
400.0 |
|
|
$ |
— |
|
|
$ |
600.0 |
|
|
$ |
1,200.0 |
|
|
Interest payments on long-term debt(a) |
|
|
439.5 |
|
|
|
72.8 |
|
|
|
133.5 |
|
|
|
109.5 |
|
|
|
123.7 |
|
|
Operating leases |
|
|
202.2 |
|
|
|
39.1 |
|
|
|
60.2 |
|
|
|
41.5 |
|
|
|
61.4 |
|
|
Purchase obligations(b) |
|
|
408.5 |
|
|
|
373.9 |
|
|
|
24.5 |
|
|
|
10.0 |
|
|
|
0.1 |
|
|
Defined benefit plan contributions(c) |
|
|
23.0 |
|
|
|
23.0 |
|
|
|
— |
|
|
|
— |
|
|
|
— |
|
|
Total |
|
$ |
3,273.2 |
|
|
$ |
908.8 |
|
|
$ |
218.2 |
|
|
$ |
761.0 |
|
|
$ |
1,385.2 |
|
|
(a) |
Interest payments on long-term debt were calculated using the borrowing rate in effect on December 31, 2019. |
|
(b) |
Purchase obligations include contracts for raw material and finished goods purchases; selling and administrative services; and capital expenditures. |
|
(c) |
Pension and postretirement contributions cannot be determined beyond 2020. |
Due to the uncertainty of the timing of settlement with taxing authorities, we are unable to make reasonably reliable estimates of the period of cash settlement of unrecognized tax benefits. Therefore, $88.0 million of unrecognized tax benefits as of December 31, 2019 have been excluded from the Contractual Obligations table above.
In addition to the contractual obligations and commitments listed and described above, we also had other commercial commitments for which we are contingently liable as of December 31, 2019. Other corporate commercial commitments include standby letters of credit of $38.7 million, in the aggregate, all of which expire in less than one year, and surety bonds of $10.7 million, of which $10.6 million matures in less than one year and $0.1 million matures in 1-3 years. These contingent commitments are not expected to have a significant impact on our liquidity.
Off-Balance Sheet Arrangements
As of December 31, 2019, we did not have any off-balance sheet arrangements that are material or reasonably likely to be material to our financial condition or results of operations.
21
Foreign Currency Risk
Certain anticipated transactions, assets and liabilities are exposed to foreign currency risk. Principal currencies hedged include the Canadian dollar, British pound, the Mexican peso and the Chinese yuan. We regularly monitor our foreign currency exposures in order to maximize the overall effectiveness of our foreign currency hedge positions. For additional information on this risk, see Item 7A. “Quantitative and Qualitative Disclosures about Market Risk” in this Annual Report on Form 10-K.
Derivative Financial Instruments
In accordance with ASC requirements for Derivatives and Hedging, we recognize all derivative contracts as either assets or liabilities on the balance sheet, and the measurement of those instruments is at fair value. If the derivative is designated as a fair value hedge and is effective, the changes in the fair value of the derivative and of the hedged item attributable to the hedged risk are recognized in earnings in the same period. If the derivative is designated as a cash flow hedge, the changes in the fair value of the derivative are recorded in other comprehensive income (“OCI”) and are recognized in the consolidated statement of income when the hedged item affects earnings. If the derivative is designated as an effective economic hedge of the net investment in a foreign operation, the changes in the fair value of the derivative is reported in the cumulative translation adjustment section of OCI. Similar to foreign currency translation adjustments, these changes in fair value are recognized in earnings only when realized upon sale or upon complete or substantially complete liquidation of the investment in the foreign entity.
Deferred currency gains of $4.1 million and $2.2 million (before tax impact) were reclassified into earnings for the year ended December 31, 2019 and 2018, respectively. Based on foreign exchange rates as of December 31, 2019, we estimate that $2.3 million of net derivative gain included in AOCI as of December 31, 2019 will be reclassified to earnings within the next twelve months.
Recently Issued Accounting Standards
The adoption of recent accounting standards, as discussed in Note 2, “Significant Accounting Policies,” to our Consolidated Financial Statements, has not had and is not expected to have a significant impact on our revenue, earnings or liquidity.
Critical Accounting Policies and Estimates
Our significant accounting policies are described in Note 2, “Significant Accounting Policies,” of the Notes to Consolidated Financial Statements in Item 8 of this Annual Report on Form 10-K. The Consolidated Financial Statements are prepared in conformity with GAAP. Preparation of the financial statements requires us to make judgments, estimates and assumptions that affect the amounts of assets and liabilities reflected in the financial statements and revenues and expenses reported for the relevant reporting periods. We believe the policies discussed below are the Company’s critical accounting policies as they include the more significant, subjective and complex judgments and estimates made when preparing our consolidated financial statements.
Allowances for Doubtful Accounts
Trade receivables are recorded at the stated amount, less allowances for discounts and doubtful accounts. The allowances for doubtful accounts represent estimated uncollectible receivables associated with potential customer defaults on contractual obligations (usually due to customers’ potential insolvency) or discounts related to early payment of accounts receivables by our customers. The allowances include provisions for certain customers where a risk of default has been specifically identified. In addition, the allowances include a provision for customer defaults on a general formula basis when it is determined that the risk of some default is probable and estimable, but cannot yet be associated with specific customers. The assessment of the likelihood of customer defaults is based on various factors, including the length of time the receivables are past due, historical collection experience and existing economic conditions. In accordance with this policy, our allowance for doubtful accounts was $3.0 million and $3.7 million as of December 31, 2019 and 2018, respectively.
Inventories
Inventory provisions are recorded to reduce inventory to the net realizable dollar value for obsolete or slow moving inventory based on assumptions about future demand and marketability of products, the impact of new product introductions, inventory levels and turns, product spoilage and specific identification of items, such as product discontinuance, engineering/material changes, or regulatory-related changes. In accordance with this policy, our inventory provision was $46.1 million and $45.3 million as of December 31, 2019 and 2018, respectively.
22
Long-lived Assets
In accordance with ASC requirements for Property, Plant and Equipment, a long-lived asset (including amortizable identifiable intangible assets) or asset group held for use is tested for recoverability whenever events or changes in circumstances indicate that its carrying amount may not be recoverable. When such events occur, we compare the sum of the undiscounted cash flows expected to result from the use and eventual disposition of the asset or asset group to the carrying amount of a long-lived asset or asset group. The cash flows are based on our best estimate of future cash flows derived from the most recent business projections. If this comparison indicates that there is an impairment, the amount of the impairment is calculated based on fair value. Fair value is estimated primarily using discounted expected future cash flows on a market-participant basis.
|
Goodwill and Indefinite-lived Intangible Assets |
|
In accordance with ASC requirements for Intangibles—Goodwill and Other, goodwill is tested for impairment at least annually in the fourth quarter, and written down when impaired. An interim impairment test is performed if an event occurs or conditions change that would more likely than not reduce the fair value of the reporting unit below the carrying value. |
|
|
|
To evaluate the recoverability of goodwill, we first assess qualitative factors to determine whether it is more likely than not that goodwill is impaired. Qualitative factors include changes in volume, margin, customers and the industry. If it is deemed more likely than not that goodwill for a reporting unit is impaired, we will perform a quantitative impairment test using a weighting of the income and market approaches. For the income approach, we use a discounted cash flow model, estimating the future cash flows of the reporting units to which the goodwill relates and then discounting the future cash flows at a market-participant-derived discount rate. In determining the estimated future cash flows, we consider current and projected future levels of income based on management’s plans for that business; business trends, prospects and market and economic conditions; and market-participant considerations. Furthermore, our cash flow projections used to assess impairment of our goodwill and other intangible assets are significantly influenced by our projection for the U.S. home products market, our annual operating plans finalized in the fourth quarter of each year, and our ability to execute on various planned cost reduction initiatives supporting operating income improvements. Our projection for the U.S. home products market is inherently uncertain and is subject to a number of factors, such as employment, home prices, credit availability, new home starts and the rate of home foreclosures. For the market approach, we apply market multiples for peer groups to the current operating results of the reporting units to determine each reporting unit’s fair value. The Company’s reporting units are operating segments, or one level below operating segments when appropriate. When the estimated fair value of a reporting unit is less than its carrying value, we measure and recognize the amount of the goodwill impairment loss based on that difference. |
|
|
|
The significant assumptions that are used to determine the estimated fair value for goodwill impairment testing include the following: third-party market forecasts of U.S. new home starts and home repair and remodel spending; management’s sales, operating income and cash flow forecasts; peer company EBITDA earnings multiples; the market-participant-based discount rate; and the perpetuity growth rate. Our estimates of reporting unit fair values are based on certain assumptions that may differ from our historical and future actual operating performance. Specifically, assumptions related to growth in the new construction and repair and remodel segments of the U.S. home products markets drive our forecasted sales growth. The market forecasts are developed using independent third-party forecasts from multiple sources. In addition, estimated future operating income and cash flow consider our historical performance at similar levels of sales volume and management’s future operating plans as reflected in annual and long-term plans that are reviewed and approved by management. |
|
|
|
Purchased intangible assets other than goodwill are amortized over their useful lives unless those lives are determined to be indefinite. The determination of the useful life of an intangible asset other than goodwill is based on factors including historical tradename performance with respect to consumer name recognition, geographic market presence, market share, plans for ongoing tradename support and promotion, customer attrition rates, and other relevant factors. Certain of our tradenames have been assigned an indefinite life as we currently anticipate that these tradenames will contribute cash flows to the Company indefinitely. Indefinite-lived intangible assets are not amortized, but are evaluated at least annually to determine whether the indefinite useful life is appropriate. We measure the fair value of identifiable intangible assets upon acquisition and we review for impairment annually in the fourth quarter and whenever market or business events indicate there may be a potential impairment of that intangible. Impairment losses are recorded to the extent that the carrying value of the indefinite-lived intangible asset exceeds its fair value. The significant assumptions that are used to determine the estimated fair value for indefinite-lived intangible assets upon acquisition and subsequent impairment testing are forecasted revenue growth rates; the assumed royalty rate; and the market-participant discount rate. We measure fair value of our indefinite-lived tradenames using the standard relief-from-royalty approach which estimates the present value of royalty income that could be hypothetically earned by licensing the brand name to a third party over the remaining useful life. The determination of fair value using this technique requires the use of estimates and assumptions related to forecasted revenue growth rates, the assumed royalty rate and the market-participant discount rate. We first assess qualitative factors to determine whether it is more likely than not that an indefinite-lived intangible asset is impaired. Qualitative factors include changes in volume, customers and the industry. If it is deemed more likely than not that an intangible asset is impaired, we will perform a quantitative impairment test. |
23
|
In the fourth quarter of 2019, we recognized an impairment charge of $12.0 million related to an indefinite-lived tradename in our Cabinets segment. This charge was the result of a strategic shift associated with new segment leadership and acceleration of our capacity rebalancing initiatives from custom cabinetry products to value-based cabinetry products as a result of lower than expected sales of custom cabinetry products compared to prior forecasts. As of December 31, 2019, the estimated fair value of this tradename equaled its carrying value of $38.6 million. |
|
|
|
In the third quarter of 2019, we recognized an impairment charge of $29.5 million related to a second indefinite-lived tradename in our Cabinets segment, which was primarily the result of a continuing shift in consumer demand from semi-custom cabinetry products to value-priced cabinetry products, which led to consecutive downward adjustments of internal sales forecasts and future growth rates associated with the tradename. In the fourth quarter of 2018, we recorded an impairment charge of $35.5 million related to the same indefinite-lived tradename, which was primarily the result of lower than forecasted sales during the fourth quarter of 2018 as well as projected changes in the mix of revenue across our tradenames in future periods, including the impact of more moderate industry growth expectations, which were finalized during our annual planning process conducted during the fourth quarter of 2018. As of December 31, 2019, the estimated fair value of this tradename exceeded its carrying value of $85.0 million by less than 10%. |
|
|
|
During the third quarter of 2018, we recorded a pre-tax impairment charge of $27.1 million related to a third indefinite-lived tradename within the Cabinets segment. This charge was primarily the result of reduced revenue growth expectations associated with Cabinets operations in Canada, including the announced closure of Company-owned retail locations. As of December 31, 2019, the estimated fair value of this tradename exceeded its carrying value of $39.1 million by less than 10%. |
|
|
|
The fair values of the impaired tradenames were measured using the relief-from-royalty approach, which estimates the present value of royalty income that could be hypothetically earned by licensing the tradename to a third party over its remaining useful life. Some of the more significant assumptions inherent in estimating the fair values include forecasted revenue growth rates for the tradename, assumed royalty rate, and a market-participant discount rate that reflects the level of risk associated with the tradenames’ future revenues and profitability. We selected the assumptions used in the financial forecasts using historical data, supplemented by current and anticipated market conditions, estimated growth rates, and management plans. These assumptions represent level 3 inputs of the fair value hierarchy (refer to Note 11). |
|
|
|
A reduction in the estimated fair value of these three tradenames could trigger additional impairment charges in future periods. Events or circumstances that could have a potential negative effect on the estimated fair value of our reporting units and indefinite-lived tradenames include: lower than forecasted revenues, actual new construction and repair and remodel growth rates that fall below our assumptions, actions of key customers, increases in discount rates, continued economic uncertainty, higher levels of unemployment, weak consumer confidence, lower levels of discretionary consumer spending, a decrease in royalty rates and a decline in the trading price of our common stock. We cannot predict the occurrence of certain events or changes in circumstances that might adversely affect the carrying value of goodwill and indefinite-lived assets. |
Defined Benefit Plans
We have a number of pension plans in the United States, covering many of the Company’s employees; however, the majority of these plans have been frozen to new participants and benefit accruals were frozen for active participants on December 31, 2016. In addition, the Company provides postretirement healthcare and life insurance benefits to certain retirees. Service cost for 2019 relates to benefit accruals in an hourly Union defined benefit plan in our Doors & Security segment, which is the only remaining plan where benefit accruals have not been frozen.
We recognize changes in the fair value of pension plan assets and net actuarial gains or losses in excess of 10 percent of the greater of the fair value of pension plan assets or each plan’s projected benefit obligation (the “corridor”) in earnings immediately upon remeasurement, which is at least annually in the fourth quarter of each year. Net actuarial gains and losses occur when actual experience differs from any of the assumptions used to value defined benefit plans or when assumptions change as they may each year. The primary factors contributing to actuarial gains and losses are changes in the discount rate used to value obligations as of the measurement date and the differences between expected and actual returns on pension plan assets. This accounting method results in the potential for volatile and difficult to forecast gains and losses. The pre-tax recognition of actuarial (gains) losses was $34.7 million and $3.8 million in 2019 and 2018, respectively. The total net actuarial losses in accumulated other comprehensive income for all defined benefit plans were $87.4 million as of December 31, 2019, compared to $71.5 million as of December 31, 2018.
We record amounts relating to these defined benefit plans based on various actuarial assumptions, including discount rates, assumed rates of return, turnover rates and health care cost trend rates. We review our actuarial assumptions on an annual basis and make modifications to the assumptions based on current economic conditions and trends. We believe that the assumptions utilized in recording our obligations under our plans are reasonable based on our experience and on advice from
24
our independent actuaries; however, differences in actual experience or changes in the assumptions may materially affect our financial condition or results of operations. The expected return on plan assets is determined based on the nature of the plans’ investments, our current asset allocation and our expectations for long-term rates of return. The weighted-average long-term expected rate of return on pension plan assets for the years ended December 31, 2019 and 2018 was 4.9% and 6.0%, respectively. Compensation increases reflect expected future compensation trends. The discount rate used to measure obligations is based on a spot-rate yield curve on a plan-by-plan basis that matches projected future benefit payments with the appropriate interest rate applicable to the timing of the projected future benefit payments. The bond portfolio used for the selection of the discount rate is from the top quartile of bonds rated by nationally recognized statistical rating organizations, and includes only non-callable bonds and those that are deemed to be sufficiently marketable with a Moody’s credit rating of Aa or higher. The weighted-average discount rate for defined benefit liabilities as of December 31, 2019 and 2018 was 3.3% and 4.4%, respectively.
For postretirement benefits, our health care trend rate assumption is based on historical cost increases and expectations for long-term increases. As of December 31, 2019, for postretirement medical and prescription drugs in the next year, our assumption was an assumed rate of increase of 6.7% for pre-65 retirees and 7.8% for post-65 retirees, declining until reaching an ultimate assumed rate of increase of 4.5% per year in 2027. As of December 31, 2018, for postretirement medical and prescription drugs in the next year, our assumption was an assumed rate of increase of 6.9% for pre-65 retirees and 8.0% for post-65 retirees, declining until reaching an ultimate assumed rate of increase of 4.5% per year in 2027.
Below is a table showing pre-tax pension and postretirement expenses, including the impact of actuarial gains and losses:
|
(In millions) |
|
|
2019 |
|
|
|
2018 |
|
||
|
Total pension expense (income) |
|
|
$ |
32.3 |
|
|
|
$ |
(5.9 |
) |
|
Actuarial loss component of expense above |
|
|
|
34.1 |
|
|
|
|
3.9 |
|
|
Total postretirement expense (income) |
|
|
|
1.1 |
|
|
|
|
(0.1 |
) |
|
Actuarial loss (gain) component of expense above |
|
|
|
0.6 |
|
|
|
|
(0.1 |
) |
|
Amortization of prior service credit component of expense above |
|
|
|
0.2 |
|
|
|
|
— |
|
The actuarial losses in 2019 were principally due to changes in discount rates. The actuarial losses in 2018 were principally due to lower asset returns. Discount rates in 2019 used to determine benefit obligations decreased by an average of 110 basis points for pension benefits. Discount rates for 2019 postretirement benefits increased an average of 220 basis points. Discount rates in 2018 used to determine benefit obligations increased by an average of 60 basis points for pension benefits. Discount rates for 2018 postretirement benefits increased an average of 80 basis points. Our actual return on plan assets in 2019 was 19.7% compared to an actuarial assumption of an average 4.9% expected return. Our actual return on plan assets in 2018 was (3.5)% compared to an actuarial assumption of an average 6.0% expected return. Significant actuarial losses in future periods would be expected if discount rates decline, actual returns on plan assets are lower than our expected return, or a combination of both occurs.
A 25 basis point change in our discount rate assumption would lead to an increase or decrease in our pension and postretirement liability of approximately $28 million. A 25 basis point change in the long-term rate of return on plan assets used in accounting for our pension plans would have a $1.6 million impact on pension expense. In addition, if required, actuarial gains and losses will be recorded in accordance with our defined benefit plan accounting method as previously described. It is not possible to forecast or predict whether there will be actuarial gains and losses in future periods, and if required, the magnitude of any such adjustment. These gains and losses are driven by differences in actual experience or changes in the assumptions that are beyond our control, such as changes in interest rates and the actual return on pension plan assets.
Income Taxes
In accordance with ASC requirements for Income Taxes, we establish deferred tax liabilities or assets for temporary differences between financial and tax reporting bases and subsequently adjust them to reflect changes in tax rates expected to be in effect when the temporary differences reverse. We record a valuation allowance reducing deferred tax assets when it is more likely than not that such assets will not be realized.
We record liabilities for uncertain income tax positions based on a two-step process. The first step is recognition, where we evaluate whether an individual tax position has a likelihood of greater than 50% of being sustained upon examination based on the technical merits of the position, including resolution of any related appeals or litigation processes. For tax positions that are currently estimated to have a less than 50% likelihood of being sustained, no tax benefit is recorded. For tax positions that have met the recognition threshold in the first step, we perform the second step of measuring the benefit to be recorded. The actual benefits ultimately realized may differ from our estimates. In future periods, changes in facts, circumstances, and new information may require us to change the recognition and measurement estimates with regard to individual tax positions. Changes in recognition and measurement estimates are recorded in the consolidated statement of income and consolidated balance sheet in the period in which such changes occur. As of December 31, 2019, we had liabilities for unrecognized tax benefits pertaining to uncertain tax positions totaling $88.0 million. It is reasonably possible that the unrecognized tax benefits
25
may decrease in the range of $3.1 million to $3.8 million in the next 12 months primarily as a result of the conclusion of U.S. federal, state and foreign income tax proceedings.
The Tax Act, enacted on December 22, 2017, made significant changes to the U.S. Internal Revenue Code including a reduction in the corporate tax rate from 35% to 21% for tax years beginning after December 31, 2017, an exemption from federal income tax for dividends received from foreign subsidiaries, and an imposition of a one-time transition tax on the deemed repatriation of cumulative foreign earnings and profits as of December 31, 2017.
Customer Program Costs
Customer programs and incentives are a common practice in our businesses. Our businesses incur customer program costs to obtain favorable product placement, to promote sales of products and to maintain competitive pricing. We record estimates to reduce revenue for customer programs and incentives, which are considered variable consideration, and include price discounts, volume-based incentives, promotions and cooperative advertising when revenue is recognized in order to determine the amount of consideration the Company will ultimately be entitled to receive. These estimates are based on historical and projected experience for each type of customer. In addition, for certain customer program incentives, we receive an identifiable benefit (goods or services) in exchange for the consideration given and record the associated expenditure in selling, general and administrative expenses. Volume allowances are accrued based on management’s estimates of customer volume achievement and other factors incorporated into customer agreements, such as new products, store sell-through, merchandising support, levels of returns and customer training. Management periodically reviews accruals for these rebates and allowances, and adjusts accruals when circumstances indicate (typically as a result of a change in volume expectations). The costs typically recognized in “selling, general and administrative expenses” include product displays, point of sale materials and media production costs.
Litigation Contingencies
Our businesses are subject to risks related to threatened or pending litigation and are routinely defendants in lawsuits associated with the normal conduct of business. Liabilities and costs associated with litigation-related loss contingencies require estimates and judgments based on our knowledge of the facts and circumstances surrounding each matter and the advice of our legal counsel. We record liabilities for litigation-related losses when a loss is probable and we can reasonably estimate the amount of the loss in accordance with ASC requirements for Contingencies. We evaluate the measurement of recorded liabilities each reporting period based on the then-current facts and circumstances specific to each matter. The ultimate losses incurred upon final resolution of litigation-related loss contingencies may differ materially from the estimated liability recorded at any particular balance sheet date. Changes in estimates are recorded in earnings in the period in which such changes occur.
Environmental Matters
We are involved in remediation activities to clean up hazardous wastes as required by federal and state laws. Liabilities for remediation costs of each site are based on our best estimate of undiscounted future costs, excluding possible insurance recoveries or recoveries from other third parties. Uncertainties about the status of laws, regulations, technology and information related to individual sites make it difficult to develop estimates of future environmental remediation exposures. Some of the potential liabilities relate to sites we own, and some relate to sites we no longer own or never owned. Several of our subsidiaries have been designated as potentially responsible parties (“PRP”) under “Superfund” or similar state laws. As of December 31, 2019, ten such instances have not been dismissed, settled or otherwise resolved. In 2019, none of our subsidiaries were identified as a PRP in a new instance and no instances were settled, dismissed or otherwise resolved. In most instances where our subsidiaries are named as a PRP, we enter into cost-sharing arrangements with other PRPs. We give notice to insurance carriers of potential PRP liability, but very rarely, if ever, receive reimbursement from insurance for PRP costs. We believe that the cost of complying with the present environmental protection laws, before considering estimated recoveries either from other PRPs or insurance, will not have a material adverse effect on our results of operations, cash flows or financial condition. At December 31, 2019 and 2018, we had accruals of $0.2 and $0.6 million, respectively, relating to environmental compliance and cleanup including, but not limited to, the above mentioned Superfund sites.
26
Item 7A. Quantitative and Qualitative Disclosures about Market Risk.
We are exposed to various market risks, including changes in interest rates, foreign currency exchange rates and commodity prices. Market risk is the potential loss arising from adverse changes in market rates and prices, such as interest rates, foreign currency exchange rates and commodity prices. We do not enter into derivatives or other financial instruments for trading or speculative purposes. We enter into financial instruments to manage and reduce the impact of changes in foreign currency exchange rates and commodity prices. The counterparties are major financial institutions.
Interest Rate Risk
The Company does not have external variable rate borrowings as of December 31, 2019.
Foreign Exchange Rate Risk
We enter into forward foreign exchange contracts principally to hedge currency fluctuations in transactions denominated in certain foreign currencies, thereby limiting our risk that would otherwise result from changes in exchange rates. The periods of the forward foreign exchange contracts correspond to the periods of the hedged transactions.
The estimated fair value of foreign currency contracts represents the amount required to enter into offsetting contracts with similar remaining maturities based on quoted market prices.
The estimated potential loss under foreign exchange contracts from movement in foreign exchange rates would not have a material impact on our results of operations, cash flows or financial condition. As part of our risk management procedure, we use a value-at-risk (“VAR”) sensitivity analysis model to estimate the maximum potential economic loss from adverse changes in foreign exchange rates over a one-day period given a 95% confidence level. The VAR model uses historical foreign exchange rates to estimate the volatility and correlation of these rates in future periods. The estimated maximum one-day loss in the fair value of the Company’s foreign currency exchange contracts using the VAR model was $0.6 million at December 31, 2019. The 95% confidence interval signifies our degree of confidence that actual losses under foreign exchange contracts would not exceed the estimated losses. The amounts disregard the possibility that foreign currency exchange rates could move in our favor. The VAR model assumes that all movements in the foreign exchange rates will be adverse. These amounts should not be considered projections of future losses, since actual results may differ significantly depending upon activity in the global financial markets. The VAR model is a risk analysis tool and should not be construed as an endorsement of the VAR model or the accuracy of the related assumptions.
Commodity Price Risk
We are subject to commodity price volatility caused by weather, supply conditions, geopolitical and economic variables, and other unpredictable external factors. From time to time, we use derivative contracts to manage our exposure to commodity price volatility.
27
Item 8. Financial Statements and Supplementary Data.
|
Consolidated Statements of Income |
Fortune Brands Home & Security, Inc. and Subsidiaries |
|
|
|
|
For years ended December 31 |
|
||||||||||
|
(In millions, except per share amounts) |
|
|
2019 |
|
|
|
2018 |
|
|
2017 |
|
|||
|
NET SALES |
|
|
$ |
|
|
|
|
$ |
|
|
|
$ |
|
|
|
Cost of products sold |
|
|
|
|
|
|
|
|
|
|
|
|
|
|
|
Selling, general and administrative expenses |
|
|
|
|
|
|
|
|
|
|
|
|
|
|
|
Amortization of intangible assets |
|
|
|
|
|
|
|
|
|
|
|
|
|
|
|
Loss on sale of product line (see Note 4) |
|
|
|
— |
|
|
|
|
— |
|
|
|
|
|
|
Asset impairment charges |
|
|
|
|
|
|
|
|
|
|
|
|
|
|
|
Restructuring charges |
|
|
|
|
|
|
|
|
|
|
|
|
|
|
|
OPERATING INCOME |
|
|
|
|
|
|
|
|
|
|
|
|
|
|
|
Interest expense |
|
|
|
|
|
|
|
|
|
|
|
|
|
|
|
Other expense (income), net |
|
|
|
|
|
|
|
|
( |
) |
|
|
( |
) |
|
Income from continuing operations before income taxes |
|
|
|
|
|
|
|
|
|
|
|
|
|
|
|
Income taxes |
|
|
|
|
|
|
|
|
|
|
|
|
|
|
|
Income from continuing operations, net of tax |
|
|
|
|
|
|
|
|
|
|
|
|
|
|
|
Loss from discontinued operations, net of tax |
|
|
|
— |
|
|
|
|
( |
) |
|
|
( |
) |
|
NET INCOME |
|
|
|
|
|
|
|
|
|
|
|
|
|
|
|
Less: Noncontrolling interests |
|
|
|
( |
) |
|
|
|
|
|
|
|
|
|
|
NET INCOME ATTRIBUTABLE TO FORTUNE BRANDS |
|
|
$ |
|
|
|
|
$ |
|
|
|
$ |
|
|
|
BASIC EARNINGS (LOSS) PER COMMON SHARE |
|
|
|
|
|
|
|
|
|
|
|
|
|
|
|
Continuing operations |
|
|
$ |
|
|
|
|
$ |
|
|
|
$ |
|
|
|
Discontinuing operations |
|
|
|
— |
|
|
|
|
— |
|
|
|
( |
) |
|
Net income attributable to Fortune Brands common shareholders |
|
|
$ |
|
|
|
|
$ |
|
|
|
$ |
|
|
|
DILUTED EARNINGS (LOSS) PER COMMON SHARE |
|
|
|
|
|
|
|
|
|
|
|
|
|
|
|
Continuing operations |
|
|
$ |
|
|
|
|
$ |
|
|
|
$ |
|
|
|
Discontinuing operations |
|
|
|
— |
|
|
|
|
— |
|
|
|
( |
) |
|
Net income attributable to Fortune Brands common shareholders |
|
|
$ |
|
|
|
|
$ |
|
|
|
$ |
|
|
|
Basic average number of shares outstanding |
|
|
|
|
|
|
|
|
|
|
|
|
|
|
|
Diluted average number of shares outstanding |
|
|
|
|
|
|
|
|
|
|
|
|
|
|
See Notes to Consolidated Financial Statements.
28
|
Consolidated Statements of Comprehensive Income |
Fortune Brands Home & Security, Inc. and Subsidiaries |
|
|
|
|
For years ended December 31 |
|
||||||||||
|
(In millions) |
|
|
2019 |
|
|
|
2018 |
|
|
2017 |
|
|||
|
NET INCOME |
|
|
$ |
|
|
|
|
$ |
|
|
|
$ |
|
|
|
Other comprehensive (loss) income, before tax: |
|
|
|
|
|
|
|
|
|
|
|
|
|
|
|
Foreign currency translation adjustments |
|
|
|
|
|
|
|
|
( |
) |
|
|
|
|
|
Unrealized gains (losses) on derivatives: |
|
|
|
|
|
|
|
|
|
|
|
|
|
|
|
Unrealized holding gains (losses) arising during period |
|
|
|
|
|
|
|
|
|
|
|
|
( |
) |
|
Less: reclassification adjustment for gains included in net income |
|
|
|
( |
) |
|
|
|
( |
) |
|
|
( |
) |
|
Unrealized gains (losses) on derivatives |
|
|
|
|
|
|
|
|
|
|
|
|
( |
) |
|
Defined benefit plans: |
|
|
|
|
|
|
|
|
|
|
|
|
|
|
|
Net actuarial (loss) gains arising during period |
|
|
|
( |
) |
|
|
|
( |
) |
|
|
|
|
|
Less: amortization of prior service credit included in net periodic pension cost |
|
|
|
— |
|
|
|
|
— |
|
|
|
( |
) |
|
Defined benefit plans |
|
|
|
( |
) |
|
|
|
( |
) |
|
|
|
|
|
Other comprehensive (loss) income, before tax |
|
|
|
( |
) |
|
|
|
( |
) |
|
|
|
|
|
Income tax benefit (expense) related to items of other comprehensive income (a) |
|
|
|
|
|
|
|
|
( |
) |
|
|
|
|
|
Other comprehensive income (loss), net of tax |
|
|
|
|
|
|
|
|
( |
) |
|
|
|
|
|
COMPREHENSIVE INCOME |
|
|
|
|
|
|
|
|
|
|
|
|
|
|
|
Less: comprehensive income attributable to noncontrolling interest |
|
|
|
( |
) |
|
|
|
|
|
|
|
— |
|
|
COMPREHENSIVE INCOME ATTRIBUTABLE TO FORTUNE BRANDS |
|
|
$ |
|
|
|
|
$ |
|
|
|
$ |
|
|
|
(a) |
|
See Notes to Consolidated Financial Statements.
29
|
Consolidated Balance Sheets |
Fortune Brands Home & Security, Inc. and Subsidiaries |
|
|
|
|
December 31 |
|
||||||
|
(In millions) |
|
|
2019 |
|
|
|
2018 |
|
||
|
ASSETS |
|
|
|
|
|
|
|
|
|
|
|
Current assets |
|
|
|
|
|
|
|
|
|
|
|
Cash and cash equivalents |
|
|
$ |
|
|
|
|
$ |
|
|
|
Accounts receivable less allowances for discounts and doubtful accounts |
|
|
|
|
|
|
|
|
|
|
|
Inventories |
|
|
|
|
|
|
|
|
|
|
|
Other current assets |
|
|
|
|
|
|
|
|
|
|
|
TOTAL CURRENT ASSETS |
|
|
|
|
|
|
|
|
|
|
|
Property, plant and equipment, net of accumulated depreciation |
|
|
|
|
|
|
|
|
|
|
|
Operating lease assets |
|
|
|
|
|
|
|
|
— |
|
|
Goodwill |
|
|
|
|
|
|
|
|
|
|
|
Other intangible assets, net of accumulated amortization |
|
|
|
|
|
|
|
|
|
|
|
Other assets |
|
|
|
|
|
|
|
|
|
|
|
TOTAL ASSETS |
|
|
$ |
|
|
|
|
$ |
|
|
|
LIABILITIES AND EQUITY |
|
|
|
|
|
|
|
|
|
|
|
Current liabilities |
|
|
|
|
|
|
|
|
|
|
|
Short-term debt |
|
|
|
|
|
|
|
|
|
|
|
Accounts payable |
|
|
|
|
|
|
|
|
|
|
|
Other current liabilities |
|
|
|
|
|
|
|
|
|
|
|
TOTAL CURRENT LIABILITIES |
|
|
|
|
|
|
|
|
|
|
|
Long-term debt |
|
|
|
|
|
|
|
|
|
|
|
Deferred income taxes |
|
|
|
|
|
|
|
|
|
|
|
Accrued defined benefit plans |
|
|
|
|
|
|
|
|
|
|
|
Operating lease liabilities |
|
|
|
|
|
|
|
|
— |
|
|
Other non-current liabilities |
|
|
|
|
|
|
|
|
|
|
|
TOTAL LIABILITIES |
|
|
|
|
|
|
|
|
|
|
|
Commitments (Note 19) and Contingencies (Note 24) |
|
|
|
|
|
|
|
|
|
|
|
Equity |
|
|
|
|
|
|
|
|
|
|
|
Common stock (a) |
|
|
|
|
|
|
|
|
|
|
|
Paid-in capital |
|
|
|
|
|
|
|
|
|
|
|
Accumulated other comprehensive loss |
|
|
|
( |
) |
|
|
|
( |
) |
|
Retained earnings |
|
|
|
|
|
|
|
|
|
|
|
Treasury stock |
|
|
|
( |
) |
|
|
|
( |
) |
|
TOTAL FORTUNE BRANDS EQUITY |
|
|
|
|
|
|
|
|
|
|
|
Noncontrolling interests |
|
|
|
|
|
|
|
|
|
|
|
TOTAL EQUITY |
|
|
|
|
|
|
|
|
|
|
|
TOTAL LIABILITIES AND EQUITY |
|
|
$ |
|
|
|
|
$ |
|
|
|
(a) |
|
See Notes to Consolidated Financial Statements.
30
|
Consolidated Statements of Cash Flows |
Fortune Brands Home & Security, Inc. and Subsidiaries |
|
|
|
|
For years ended December 31 |
|
||||||||||
|
(In millions) |
|
|
2019 |
|
|
|
2018 |
|
|
2017 |
|
|||
|
OPERATING ACTIVITIES |
|
|
|
|
|
|
|
|
|
|
|
|
|
|
|
Net income |
|
|
$ |
|
|
|
|
$ |
|
|
|
$ |
|
|
|
Non-cash expense (income): |
|
|
|
|
|
|
|
|
|
|
|
|
|
|
|
Depreciation |
|
|
|
|
|
|
|
|
|
|
|
|
|
|
|
Amortization of intangibles |
|
|
|
|
|
|
|
|
|
|
|
|
|
|
|
Non-cash lease expense |
|
|
|
|
|
|
|
|
— |
|
|
|
— |
|
|
Stock-based compensation |
|
|
|
|
|
|
|
|
|
|
|
|
|
|
|
(Gain) loss on sale of property, plant and equipment |
|
|
|
( |
) |
|
|
|
|
|
|
|
|
|
|
Loss on sale of product line |
|
|
|
— |
|
|
|
|
— |
|
|
|
|
|
|
Asset impairment charges |
|
|
|
|
|
|
|
|
|
|
|
|
|
|
|
Recognition of actuarial losses (gains) |
|
|
|
|
|
|
|
|
|
|
|
|
( |
) |
|
Deferred taxes |
|
|
|
( |
) |
|
|
|
|
|
|
|
( |
) |
|
Amortization of deferred financing costs |
|
|
|
|
|
|
|
|
|
|
|
|
|
|
|
Changes in assets and liabilities including effects subsequent to acquisitions |
|
|
|
|
|
|
|
|
|
|
|
|
|
|
|
(Increase) decrease in accounts receivable |
|
|
|
( |
) |
|
|
|
|
|
|
|
|
|
|
Increase in inventories |
|
|
|
( |
) |
|
|
|
( |
) |
|
|
( |
) |
|
Increase in accounts payable |
|
|
|
|
|
|
|
|
|
|
|
|
|
|
|
Increase in other assets |
|
|
|
( |
) |
|
|
|
( |
) |
|
|
( |
) |
|
(Decrease) increase in accrued taxes |
|
|
|
( |
) |
|
|
|
|
|
|
|
( |
) |
|
Increase (decrease) in accrued expenses and other liabilities |
|
|
|
|
|
|
|
|
( |
) |
|
|
|
|
|
NET CASH PROVIDED BY OPERATING ACTIVITIES |
|
|
|
|
|
|
|
|
|
|
|
|
|
|
|
INVESTING ACTIVITIES |
|
|
|
|
|
|
|
|
|
|
|
|
|
|
|
Capital expenditures(a) |
|
|
|
( |
) |
|
|
|
( |
) |
|
|
( |
) |
|
Proceeds from the disposition of assets |
|
|
|
|
|
|
|
|
|
|
|
|
|
|
|
Proceeds from sale of product line |
|
|
|
— |
|
|
|
|
— |
|
|
|
|
|
|
Cost of acquisitions, net of cash acquired |
|
|
|
— |
|
|
|
|
( |
) |
|
|
( |
) |
|
Cost of investments in equity securities |
|
|
|
— |
|
|
|
|
( |
) |
|
|
— |
|
|
Other investing activities, net |
|
|
|
— |
|
|
|
|
|
|
|
|
— |
|
|
NET CASH USED IN INVESTING ACTIVITIES |
|
|
|
( |
) |
|
|
|
( |
) |
|
|
( |
) |
|
FINANCING ACTIVITIES |
|
|
|
|
|
|
|
|
|
|
|
|
|
|
|
(Decrease) increase in short-term debt |
|
|
|
( |
) |
|
|
|
|
|
|
|
— |
|
|
Issuance of long-term debt |
|
|
|
|
|
|
|
|
|
|
|
|
|
|
|
Repayment of long-term debt |
|
|
|
( |
) |
|
|
|
( |
) |
|
|
( |
) |
|
Proceeds from the exercise of stock options |
|
|
|
|
|
|
|
|
|
|
|
|
|
|
|
Employee withholding taxes paid related to stock-based compensation |
|
|
|
( |
) |
|
|
|
( |
) |
|
|
( |
) |
|
Deferred acquisition payments |
|
|
|
( |
) |
|
|
|
( |
) |
|
|
( |
) |
|
Dividends to stockholders |
|
|
|
( |
) |
|
|
|
( |
) |
|
|
( |
) |
|
Treasury stock purchases |
|
|
|
( |
) |
|
|
|
( |
) |
|
|
( |
) |
|
Other financing activities, net |
|
|
|
( |
) |
|
|
|
( |
) |
|
|
— |
|
|
NET CASH USED IN FINANCING ACTIVITIES |
|
|
|
( |
) |
|
|
|
( |
) |
|
|
( |
) |
|
Effect of foreign exchange rate changes on cash |
|
|
|
|
|
|
|
|
( |
) |
|
|
|
|
|
NET INCREASE (DECREASE) IN CASH AND CASH EQUIVALENTS |
|
|
$ |
|
|
|
|
$ |
( |
) |
|
$ |
|
|
|
Cash, cash equivalents and restricted cash(b) at beginning of year |
|
|
$ |
|
|
|
|
$ |
|
|
|
$ |
|
|
|
Cash, cash equivalents and restricted cash(b) at end of year |
|
|
$ |
|
|
|
|
$ |
|
|
|
$ |
|
|
|
Cash paid during the year for |
|
|
|
|
|
|
|
|
|
|
|
|
|
|
|
Interest |
|
|
$ |
|
|
|
|
$ |
|
|
|
$ |
|
|
|
Income taxes paid directly to taxing authorities |
|
|
|
|
|
|
|
|
|
|
|
|
|
|
|
Dividends declared but not paid |
|
|
|
|
|
|
|
|
|
|
|
|
|
|
|
(a) |
|
|
(b) |
|
See Notes to Consolidated Financial Statements.
31
|
Consolidated Statements of Equity |
Fortune Brands Home & Security, Inc. and Subsidiaries |
|
(In millions) |
|
Common Stock |
|
|
Paid-In Capital |
|
|
Accumulated Other Comprehensive (Loss) Income |
|
|
Retained Earnings |
|
|
Treasury Stock |
|
|
Non- controlling Interests |
|
|
Total Equity |
|
|||||||
|
Balance at December 31, 2016 |
|
$ |
|
|
|
$ |
|
|
|
$ |
( |
) |
|
$ |
|
|
|
$ |
( |
) |
|
$ |
|
|
|
$ |
|
|
|
Comprehensive income: |
|
|
|
|
|
|
|
|
|
|
|
|
|
|
|
|
|
|
|
|
|
|
|
|
|
|
|
|
|
Net income |
|
|
— |
|
|
|
— |
|
|
|
— |
|
|
|
|
|
|
|
— |
|
|
|
|
|
|
|
|
|
|
Other comprehensive income (loss) |
|
|
— |
|
|
|
— |
|
|
|
|
|
|
|
— |
|
|
|
— |
|
|
|
— |
|
|
|
|
|
|
Stock options exercised |
|
|
— |
|
|
|
|
|
|
|
— |
|
|
|
— |
|
|
|
— |
|
|
|
— |
|
|
|
|
|
|
Stock-based compensation |
|
|
— |
|
|
|
|
|
|
|
— |
|
|
|
— |
|
|
|
( |
) |
|
|
— |
|
|
|
|
|
|
Treasury stock purchase |
|
|
— |
|
|
|
— |
|
|
|
— |
|
|
|
— |
|
|
|
( |
) |
|
|
— |
|
|
|
( |
) |
|
Dividends ($ |
|
|
— |
|
|
|
— |
|
|
|
— |
|
|
|
( |
) |
|
|
— |
|
|
|
— |
|
|
|
( |
) |
|
Balance at December 31, 2017 |
|
$ |
|
|
|
$ |
|
|
|
$ |
( |
) |
|
$ |
|
|
|
$ |
( |
) |
|
$ |
|
|
|
$ |
|
|
|
Comprehensive income: |
|
|
|
|
|
|
|
|
|
|
|
|
|
|
|
|
|
|
|
|
|
|
|
|
|
|
|
|
|
Net income |
|
|
— |
|
|
|
— |
|
|
|
— |
|
|
|
|
|
|
|
— |
|
|
|
|
|
|
|
|
|
|
Other comprehensive income (loss) |
|
|
— |
|
|
|
— |
|
|
|
( |
) |
|
|
— |
|
|
|
— |
|
|
|
— |
|
|
|
( |
) |
|
Stock options exercised |
|
|
|
|
|
|
|
|
|
|
— |
|
|
|
— |
|
|
|
— |
|
|
|
— |
|
|
|
|
|
|
Stock-based compensation |
|
|
— |
|
|
|
|
|
|
|
— |
|
|
|
— |
|
|
|
( |
) |
|
|
— |
|
|
|
|
|
|
Treasury stock purchase |
|
|
— |
|
|
|
— |
|
|
|
— |
|
|
|
— |
|
|
|
( |
) |
|
|
— |
|
|
|
( |
) |
|
Dividends ($ |
|
|
— |
|
|
|
— |
|
|
|
— |
|
|
|
( |
) |
|
|
— |
|
|
|
— |
|
|
|
( |
) |
|
Balance at December 31, 2018 |
|
$ |
|
|
|
$ |
|
|
|
$ |
( |
) |
|
$ |
|
|
|
$ |
( |
) |
|
$ |
|
|
|
$ |
|
|
|
Comprehensive income: |
|
|
|
|
|
|
|
|
|
|
|
|
|
|
|
|
|
|
|
|
|
|
|
|
|
|
|
|
|
Net income |
|
|
— |
|
|
|
— |
|
|
|
— |
|
|
|
|
|
|
|
— |
|
|
|
( |
) |
|
|
|
|
|
Other comprehensive income (loss) |
|
|
— |
|
|
|
— |
|
|
|
|
|
|
|
— |
|
|
|
— |
|
|
|
— |
|
|
|
|
|
|
Stock options exercised |
|
|
— |
|
|
|
|
|
|
|
— |
|
|
|
— |
|
|
|
— |
|
|
|
— |
|
|
|
|
|
|
Stock-based compensation |
|
|
— |
|
|
|
|
|
|
|
— |
|
|
|
— |
|
|
|
( |
) |
|
|
— |
|
|
|
|
|
|
Adoption of ASU 2018-02 |
|
|
— |
|
|
|
— |
|
|
|
( |
) |
|
|
|
|
|
|
— |
|
|
|
— |
|
|
|
— |
|
|
Treasury stock purchase |
|
|
— |
|
|
|
— |
|
|
|
— |
|
|
|
— |
|
|
|
( |
) |
|
|
— |
|
|
|
( |
) |
|
Dividends ($ |
|
|
— |
|
|
|
— |
|
|
|
— |
|
|
|
( |
) |
|
|
— |
|
|
|
— |
|
|
|
( |
) |
|
Balance at December 31, 2019 |
|
$ |
|
|
|
$ |
|
|
|
$ |
( |
) |
|
$ |
|
|
|
$ |
( |
) |
|
$ |
|
|
|
$ |
|
|
See Notes to Consolidated Financial Statements.
32
Notes to Consolidated Financial Statements
1. Background and Basis of Presentation
The Company is a leading home and security products company with a portfolio of leading branded products used for residential home repair, remodeling, new construction and security applications. References to “Fortune Brands,” “the Company,” “we,” “our” and “us” refer to Fortune Brands Home & Security, Inc. and its consolidated subsidiaries as a whole, unless the context otherwise requires.
Basis of Presentation
|
The consolidated financial statements in this Annual Report on Form 10-K have been derived from the accounts of the Company and its wholly-owned subsidiaries. The Company’s consolidated financial statements are based on a fiscal year ending December 31. Certain of the Company’s subsidiaries operate on a 52 or 53 week fiscal year ending during the month of December. |
|
|
|
In September 2018, we acquired Fiberon. The financial results of Fiberon were included in the Company’s consolidated statements of income and statements of cash flow beginning in September 2018 and the consolidated balance sheet as of December 31, 2018. The results of operations are included in the Doors & Security segment. |
2. Significant Accounting Policies
Use of Estimates The presentation of financial statements in accordance with U.S. generally accepted accounting principles (“GAAP”) requires us to make estimates and assumptions that affect reported amounts and related disclosures. Actual results in future periods could differ from those estimates.
Cash and Cash Equivalents Highly liquid investments with an original maturity of
Allowances for Doubtful Accounts Trade receivables are recorded at the stated amount, less allowances for discounts and doubtful accounts. The allowances for doubtful accounts represent estimated uncollectible receivables associated with potential customer defaults on contractual obligations (usually due to customers’ potential insolvency) or discounts related to early payment of accounts receivables by our customers. The allowances include provisions for certain customers where a risk of default has been specifically identified. In addition, the allowances include a provision for customer defaults on a general formula basis when it is determined that the risk of some default is probable and estimable, but cannot yet be associated with specific customers. The assessment of the likelihood of customer defaults is based on various factors, including the length of time the receivables are past due, historical collection experience and existing economic conditions. In accordance with this policy, our allowance for doubtful accounts was $
Inventories Inventory provisions are recorded to reduce inventory to the net realizable dollar value for obsolete or slow moving inventory based on assumptions about future demand and marketability of products, the impact of new product introductions, inventory levels and turns, product spoilage and specific identification of items, such as product discontinuance, engineering/material changes, or regulatory-related changes.
33
Property, Plant and Equipment Property, plant and equipment are carried at cost. Depreciation is provided, principally on a straight-line basis, over the estimated useful lives of the assets. Gains or losses resulting from dispositions are included in operating income. Betterments and renewals, which improve and extend the life of an asset, are capitalized; maintenance and repair costs are expensed as incurred. Assets held for use to be disposed of at a future date are depreciated over the remaining useful life. Assets to be sold are written down to fair value less costs to sell at the time the assets are being actively marketed for sale.
|
Buildings and leasehold improvements |
|
|
Machinery and equipment |
|
|
Software |
|
Long-lived Assets In accordance with ASC requirements for Property, Plant and Equipment, a long-lived asset (including amortizable identifiable intangible assets) or asset group held for use is tested for recoverability whenever events or changes in circumstances indicate that its carrying amount may not be recoverable. When such events occur, we compare the sum of the undiscounted cash flows expected to result from the use and eventual disposition of the asset or asset group to the carrying amount of a long-lived asset or asset group. The cash flows are based on our best estimate of future cash flows derived from the most recent business projections. If this comparison indicates that there is an impairment, the amount of the impairment is calculated based on fair value. Fair value is estimated primarily using discounted expected future cash flows on a market-participant basis.
During 2019, we recorded an impairment of $
Leases Operating lease assets and operating lease liabilities are recognized based on the present value of the future lease payments over the lease term at commencement date. As most of our lease contracts do not provide an explicit interest rate, we use our incremental borrowing rate in determining the present value of future lease payments. Our incremental borrowing rates include estimates related to the impact of collateralization and the economic environment where the leased asset is located. The operating lease assets also include any prepaid lease payments and initial direct costs incurred, but exclude lease incentives received at lease commencement. Our lease terms include options to extend or terminate the lease when it is reasonably certain that we will exercise that option. Our leases have remaining lease terms of 1 to 36 years, some of which may include options to extend or terminate the lease. Operating lease expense is recognized on a straight-line basis over the lease term. We do not recognize leases with an initial term of twelve months or less on the balance sheet and instead recognize the related lease payments as expense in the statement of comprehensive income on a straight-line basis over the lease term. We account for lease and non-lease components as a single lease component for all asset classes. Additionally, for certain equipment leases, we apply a portfolio approach and account for multiple lease components as a single lease component. Certain of our lease agreements include variable rental payments, including rental payments adjusted periodically for inflation. Variable rental payments are expensed during the period they are incurred and therefore are excluded from our lease assets and liabilities. Our lease agreements do not contain any material residual value guarantees or material restrictive covenants.
Goodwill and Indefinite-lived Intangible Assets In accordance with ASC requirements for Intangibles—Goodwill and Other, goodwill is tested for impairment at least annually in the fourth quarter, and written down when impaired. An interim impairment test is performed if an event occurs or conditions change that would more likely than not reduce the fair value of the reporting unit below the carrying value. |
To evaluate the recoverability of goodwill, we first assess qualitative factors to determine whether it is more likely than not that goodwill is impaired. Qualitative factors include changes in volume, margin, customers and the industry. If it is deemed more likely than not that goodwill for a reporting unit is impaired, we will perform a quantitative impairment test using a weighting of the income and market approaches. For the income approach, we use a discounted cash flow model, estimating the future cash flows of the reporting units to which the goodwill relates and then discounting the future cash flows at a market-participant-based discount rate. In determining the estimated future cash flows, we consider current and projected future levels of income based on management’s plans for that business; business trends, prospects and market and economic conditions; and market-participant considerations. Furthermore, our cash flow projections used to assess impairment of our goodwill and other intangible assets are significantly influenced by our projection for the U.S. home products market, our annual operating plans finalized in the fourth quarter of each year, and our ability to execute on various planned cost reduction initiatives supporting operating income improvements. Our projection for the U.S. home products market is inherently uncertain and is subject to a number of factors, such as employment, home prices, credit availability, new home starts and the rate of home foreclosures. For the market approach, we apply market multiples for peer groups to the current operating results of the reporting units to determine each reporting unit’s fair value. The Company’s reporting units are operating segments, or one level below operating segments when appropriate. When the estimated fair value of a reporting unit is less than its carrying value, we measure and recognize the amount of the goodwill impairment loss based on that difference. |
34
The significant assumptions that are used to determine the estimated fair value for goodwill impairment testing include the following: third-party market forecasts of U.S. new home starts and home repair and remodel spending; management’s sales, operating income and cash flow forecasts; peer company EBITDA earnings multiples; the market-participant-based discount rate; and the perpetuity growth rate. Our estimates of reporting unit fair values are based on certain assumptions that may differ from our historical and future actual operating performance. Specifically, assumptions related to growth in the new construction and repair and remodel segments of the U.S. home products markets drive our forecasted sales growth. The market forecasts are developed using independent third-party forecasts from multiple sources. In addition, estimated future operating income and cash flow consider our historical performance at similar levels of sales volume and management’s future operating plans as reflected in annual and long-term plans that are reviewed and approved by management. |
Purchased intangible assets other than goodwill are amortized over their useful lives unless those lives are determined to be indefinite. The determination of the useful life of an intangible asset other than goodwill is based on factors including historical tradename performance with respect to consumer name recognition, geographic market presence, market share, plans for ongoing tradename support and promotion, customer attrition rates, and other relevant factors. Certain of our tradenames have been assigned an indefinite life as we currently anticipate that these tradenames will contribute cash flows to the Company indefinitely. Indefinite-lived intangible assets are not amortized, but are evaluated at least annually to determine whether the indefinite useful life is appropriate. We measure the fair value of identifiable intangible assets upon acquisition and we review for impairment annually in the fourth quarter and whenever market or business events indicate there may be a potential impairment of that intangible. Impairment losses are recorded to the extent that the carrying value of the indefinite-lived intangible asset exceeds its fair value. The significant assumptions that are used to determine the estimated fair value for indefinite-lived intangible assets upon acquisition and subsequent impairment testing are forecasted revenue growth rates; the assumed royalty rate; and the market-participant discount rate. We measure fair value of our indefinite-lived tradenames using the standard relief-from-royalty approach which estimates the present value of royalty income that could be hypothetically earned by licensing the brand name to a third party over the remaining useful life. The determination of fair value using this technique requires the use of estimates and assumptions related to forecasted revenue growth rates, the assumed royalty rate and the market-participant discount rate. We first assess qualitative factors to determine whether it is more likely than not that an indefinite-lived intangible asset is impaired. Qualitative factors include changes in volume, customers and the industry. If it is deemed more likely than not that an intangible asset is impaired, we will perform a quantitative impairment test.
|
Investments in Equity Securities In accordance with ASC requirements for Investments – equity securities, we account for non-controlling investments in equity securities at fair value, with any gains or losses recognized through other income and expense. Equity securities without readily determinable fair values are recorded at cost minus impairment, plus or minus any changes resulting from observable price changes in orderly transactions for identical or similar investments of the same issuer.
During the fourth quarter of 2018, our Plumbing segment entered into strategic partnerships with several companies who incorporate technology into plumbing-related products, and at the same time acquired non-controlling equity interests in some of our partners. This includes an investment in Flo Technologies, Inc. (“Flo”), a U.S. manufacturer of a comprehensive water monitoring and shut-off system with leak detection and proactive leak detection technologies. In January 2020, we reached an agreement to acquire 100% of Flo’s outstanding shares in a multi-phase transaction. In January 2020, we acquired additional shares in exchange for $52.1 million in cash, including direct transaction costs, which combined with our existing investment resulted in majority ownership of the outstanding shares. From January 2020, we will apply the equity method of accounting to our investment in Flo as the minority shareholders have substantive participating rights which preclude consolidation in our results of operations and statements of financial position and cash flows. The substantive participating rights are due to expire in the first quarter of 2021, at which time we will obtain control of, and begin consolidating, Flo in our results. The second phase, scheduled to occur in the first quarter of 2022, will result in the acquisition of the remaining outstanding shares of Flo for a price based on Flo’s 2021 sales and earnings.
As of December 31, 2019, all of our investments in our strategic partners do not have readily determinable fair values. As of December 31, 2019 and 2018, the carrying value of our investments was $
35
Defined Benefit Plans We have a number of pension plans in the United States, covering many of the Company’s employees. In addition, the Company provides postretirement health care and life insurance benefits to certain retirees. Service cost for 2019 relates to benefit accruals in an hourly Union defined benefit plan in our Doors & Security segment. Benefit accruals under all other defined benefit pension plans were frozen as of December 31, 2016.
We record amounts relating to these plans based on calculations in accordance with ASC requirements for Compensation – Retirement Benefits, which include various actuarial assumptions, including discount rates, assumed rates of return, compensation increases, turnover rates and health care cost trend rates. We recognize changes in the fair value of pension plan assets and net actuarial gains or losses in excess of 10 percent of the greater of the fair value of pension plan assets or each plan’s projected benefit obligation (the “corridor”) in earnings immediately upon remeasurement, which is at least annually in the fourth quarter of each year. We review our actuarial assumptions on an annual basis and make modifications to the assumptions based on current economic conditions and trends. The discount rate used to measure obligations is based on a spot-rate yield curve on a plan-by-plan basis that matches projected future benefit payments with the appropriate interest rate applicable to the timing of the projected future benefit payments. The expected rate of return on plan assets is determined based on the nature of the plans’ investments, our current asset allocation and our expectations for long-term rates of return. Compensation increases reflect expected future compensation trends. For postretirement benefits, our health care trend rate assumption is based on historical cost increases and expectations for long-term increases. The cost or benefit of plan changes, such as increasing or decreasing benefits for prior employee service (prior service cost), is deferred and included in expense on a straight-line basis over the average remaining service period of the related employees. We believe that the assumptions utilized in recording obligations under our plans, which are presented in Note 16, “Defined Benefit Plans,” are reasonable based on our experience and on advice from our independent actuaries; however, differences in actual experience or changes in the assumptions may materially affect our financial position and results of operations. We will continue to monitor these assumptions as market conditions warrant.
Insurance Reserves We provide for expenses associated with workers’ compensation and product liability obligations when such amounts are probable and can be reasonably estimated. The accruals are adjusted as new information develops or circumstances change that would affect the estimated liability.
Litigation Contingencies Our businesses are subject to risks related to threatened or pending litigation and are routinely defendants in lawsuits associated with the normal conduct of business. Liabilities and costs associated with litigation-related loss contingencies require estimates and judgments based on our knowledge of the facts and circumstances surrounding each matter and the advice of our legal counsel. We record liabilities for litigation-related losses when a loss is probable and we can reasonably estimate the amount of the loss in accordance with ASC requirements for Contingencies. We evaluate the measurement of recorded liabilities each reporting period based on the then-current facts and circumstances specific to each matter. The ultimate losses incurred upon final resolution of litigation-related loss contingencies may differ materially from the estimated liability recorded at any particular balance sheet date. Changes in estimates are recorded in earnings in the period in which such changes occur.
Income Taxes In accordance with ASC requirements for Income Taxes, we establish deferred tax liabilities or assets for temporary differences between financial and tax reporting bases and subsequently adjust them to reflect changes in tax rates expected to be in effect when the temporary differences reverse. We record a valuation allowance reducing deferred tax assets when it is more likely than not that such assets will not be realized.
We record liabilities for uncertain income tax positions based on a two-step process. The first step is recognition, where we evaluate whether an individual tax position has a likelihood of greater than 50% of being sustained upon examination based on the technical merits of the position, including resolution of any related appeals or litigation processes. For tax positions that are currently estimated to have a less than 50% likelihood of being sustained, no tax benefit is recorded. For tax positions that have met the recognition threshold in the first step, we perform the second step of measuring the benefit to be recorded. The actual benefits ultimately realized may differ from our estimates. In future periods, changes in facts, circumstances, and new information may require us to change the recognition and measurement estimates with regard to individual tax positions. Changes in recognition and measurement estimates are recorded in the consolidated statement of income and consolidated balance sheet in the period in which such changes occur. As of December 31, 2019, we had liabilities for unrecognized tax benefits pertaining to uncertain tax positions totaling $
The Tax Act, enacted on December 22, 2017, made significant changes to the U.S. Internal Revenue Code including a reduction in the corporate tax rate from 35% to 21% for tax years beginning after December 31, 2017, an exemption from federal income tax for dividends received from foreign subsidiaries, and an imposition of a one-time transition tax on the deemed repatriation of cumulative foreign earnings and profits as of December 31, 2017.
36
Revenue Recognition The Company recognizes revenue for the sale of goods based on its assessment of when control transfers to our customers. Refer to Note 15 for additional information.
Cost of Products Sold Cost of products sold includes all costs to make products saleable, such as labor costs, inbound freight, purchasing and receiving costs, inspection costs and internal transfer costs. In addition, all depreciation expense associated with assets used to manufacture products and make them saleable is included in cost of products sold.
Customer Program Costs Customer programs and incentives are a common practice in our businesses. Our businesses incur customer program costs to obtain favorable product placement, to promote sales of products and to maintain competitive pricing. We record estimates to reduce revenue for customer programs and incentives, which are considered variable consideration, and include price discounts, volume-based incentives, promotions and cooperative advertising when revenue is recognized in order to determine the amount of consideration the Company will ultimately be entitled to receive. These estimates are based on historical and projected experience for each type of customer. In addition, for certain customer program incentives, we receive an identifiable benefit (goods or services) in exchange for the consideration given and record the associated expenditure in selling, general and administrative expenses. Volume allowances are accrued based on management’s estimates of customer volume achievement and other factors incorporated into customer agreements, such as new products, store sell-through, merchandising support, levels of returns and customer training. Management periodically reviews accruals for these rebates and allowances, and adjusts accruals when circumstances indicate (typically as a result of a change in volume expectations). The costs typically recognized in “selling, general and administrative expenses” include product displays, point of sale materials and media production costs. The costs typically recognized in selling, general and administrative expenses include product displays, point of sale materials and media production costs. The costs included in the selling, general and administrative expenses category were $
Selling, General and Administrative Expenses Selling, general and administrative expenses include advertising costs; marketing costs; selling costs, including commissions; research and development costs; shipping and handling costs, including warehousing costs; and general and administrative expenses. Shipping and handling costs included in selling, general and administrative expenses were $
Advertising costs, which amounted to $
Research and development expenses include product development, product improvement, product engineering and process improvement costs. Research and development expenses, which were $
Stock-based Compensation Stock-based compensation expense, measured as the fair value of an award on the date of grant, is recognized in the financial statements over the period that an employee is required to provide services in exchange for the award. The fair value of each option award is measured on the date of grant using the Black-Scholes option-pricing model. The fair value of each performance share award is based on the average of the high and low share prices on the date of grant and the probability of meeting performance targets. The fair value of each restricted stock unit granted is equal to the average of the high and low share prices on the date of grant. See Note 14, “Stock-Based Compensation,” for additional information.
Earnings Per Share Earnings per common share is calculated by dividing net income attributable to Fortune Brands by the weighted-average number of shares of common stock outstanding during the year. Diluted earnings per common share include the impact of all potentially dilutive securities outstanding during the year. See Note 22, “Earnings Per Share,” for further discussion.
Foreign Currency Translation Foreign currency balance sheet accounts are translated into U.S. dollars at the actual rates of exchange at the balance sheet date. Income and expenses are translated at the average rates of exchange in effect during the period for the foreign subsidiaries where the local currency is the functional currency. The related translation adjustments are made directly to a separate component of the “accumulated other comprehensive income” (“AOCI”) caption in equity. Transactions denominated in a currency other than the functional currency of a subsidiary are translated into functional currency with resulting transaction gains or losses recorded in other expense, net.
37
Derivative Financial Instruments In accordance with ASC requirements for Derivatives and Hedging, we recognize all derivative contracts as either assets or liabilities on the balance sheet, and the measurement of those instruments is at fair value. If the derivative is designated as a fair value hedge and is effective, the changes in the fair value of the derivative and of the hedged item attributable to the hedged risk are recognized in earnings in the same period. If the derivative is designated as a cash flow hedge, the changes in the fair value of the derivative are recorded in other comprehensive income (“OCI”) and are recognized in the consolidated statement of income when the hedged item affects earnings. If the derivative is designated as an effective economic hedge of the net investment in a foreign operation, the changes in the fair value of the derivative is reported in the cumulative translation adjustment section of OCI. Similar to foreign currency translation adjustments, these changes in fair value are recognized in earnings only when realized upon sale or upon complete or substantially complete liquidation of the investment in the foreign entity.
Deferred currency gains of $
Recently Issued Accounting Standards
Leases
In February 2016, the Financial Accounting Standards Board (“FASB”) issued Accounting Standards Update (“ASU”) 2016-02, which requires lessees to recognize almost all leases on their balance sheet as “right-of-use” assets and lease liabilities but recognize related expenses in a manner similar to previous accounting guidance. The guidance also eliminates previous real estate-specific provisions for all entities. In January 2018, the FASB issued ASU 2018-01, which clarifies the application of the new leases guidance to land easements. In July 2018, the FASB issued ASU 2018-10 and ASU 2018-11, which clarify certain guidance included in ASU 2016-02 and introduces a new optional transition method, which does not require revisions to comparative periods.
We adopted this standard as of January 1, 2019 using the transition method introduced by ASU 2018-11, which does not require revisions to comparative periods. We elected to implement the transition package of practical expedients permitted within the new standard, which among other things, allows us to carryforward the historical lease classification. In addition, we elected the hindsight practical expedient to determine the lease term for existing leases.
Adoption of the new standard resulted in the recording of lease assets and lease liabilities of approximately $
Improvements to Accounting for Hedging Activities
Reclassification of Certain Tax Effects from Accumulated Other Comprehensive Income
In February 2018, the FASB issued ASU 2018-02, which permits companies to reclassify to retained earnings the tax effects stranded in accumulated other comprehensive income (“AOCI”) as a result of the U.S. Tax Cuts and Jobs Act of 2017. We adopted this standard on January 1, 2019, which resulted in a reclassification of $
Improvements to Nonemployee Share-Based Payment Accounting
In June 2018, the FASB issued ASU 2018-07, which simplifies the accounting for share-based arrangements with nonemployees. The new guidance generally aligns the accounting for share-based awards to nonemployees with the guidance for share-based awards to employees. The guidance was effective for the Company’s fiscal year beginning January 1, 2019. The adoption of this standard did not have a material effect on our financial statements.
38
Codification Improvements
In July 2018, the FASB issued ASU 2018-09, which includes technical corrections, clarifications, and other minor improvements to various areas including business combinations, fair value measurements and hedging. The transition and effective date guidance is based on the facts and circumstances of each amendment. Some of the amendments in this standard were effective immediately, while others were effective for the Company’s fiscal year beginning January 1, 2019. The adoption of this standard did not have a material effect on our financial statements.
Changes to the Disclosure Requirements for Defined Benefit Plans
In August 2018, the FASB issued ASU 2018-14, which removes several disclosure requirements, including the amount in AOCI expected to be recognized in income over the next fiscal year and the effects of a
Financial Instruments—Credit Losses
In June 2016, the FASB issued ASU 2016-13, which changes the impairment model for most financial assets and certain other instruments that are not measured at fair value through net income. The new guidance applies to most financial assets measured at amortized cost, including trade and other receivables and loans as well as off-balance-sheet credit exposures (e.g., loan commitments and standby letters of credit). The standard will replace the “incurred loss” approach under the current guidance with an “expected loss” model that requires an entity to estimate its lifetime “expected credit loss.” The standard is effective for the Company’s fiscal year beginning January 1, 2020 with early adoption permitted beginning January 1, 2019. We do not expect the adoption of this guidance to have a material effect on our financial statements.
Changes to the Disclosure Requirements for Fair Value Measurement
In August 2018, the FASB issued ASU 2018-13, which removes the requirement to disclose: 1) amount of and reasons for transfers between Levels 1 and 2 of the fair value hierarchy, 2) policy for timing of transfers between levels, and 3) valuation processes for Level 3 investments. In addition, this guidance modifies and adds other disclosure requirements, which primarily relate to valuation of Level 3 assets and liabilities. The guidance is effective for the Company’s fiscal year beginning January 1, 2020, with early adoption permitted. We do not expect the adoption of this guidance to have a material effect on our financial statements.
Accounting for Implementation Costs Incurred in a Cloud Computing Arrangement That is a Service Contract
In August 2018, the FASB issued ASU 2018-15, which aligns the requirements for capitalizing implementation costs incurred in a hosting arrangement that is a service contract with the requirements for capitalizing implementation costs incurred to develop or obtain internal-use software. Costs to obtain software, including configuration and integration with legacy IT systems, coding and testing, including parallel process phases are eligible for capitalization under the new standard. In addition, activities that would be expensed include costs related to vendor demonstrations, determining performance and technology requirements and training activities. The standard is effective for the Company’s fiscal year beginning January 1, 2020, with early adoption permitted. We do not expect the adoption of this guidance to have a material effect on our financial statements.
Simplifying the Accounting for Income Taxes
In December 2019, the FASB issued ASU 2019-12, which is intended to simplify accounting for income taxes and improve consistency in application. ASU 2019-12 amends certain elements of income tax accounting, including but not limited to intraperiod tax allocations, step-ups in tax basis of goodwill, and calculating taxes on year-to-date losses in interim periods. The guidance is effective for the Company’s fiscal year beginning January 1, 2021, with early adoption permitted. We are assessing the impact that the adoption of this guidance will have on our financial statements.
Clarifications in Accounting for Equity Securities
In January 2020, the FASB issued ASU 2020-01, which clarifies the interactions between accounting for equity investments (ASC 321), equity method accounting (ASC 323) and derivatives and hedges (ASC 815). As a result of the ASU, when entities apply the measurement alternative to non-controlling equity investments under ASC 321, and must transition to the equity method of accounting because of an observable transaction, existing investments should be remeasured immediately before applying the equity method of accounting. Additionally, it states that if entities hold non-derivative forward contracts or purchased call options to acquire equity securities, such instruments should be measured using the fair value principles of ASC 321 before settlement or exercise. The guidance is effective for the Company’s fiscal year beginning on January 1, 2021, with early adoption permitted. We are assessing the impact that the adoption of this guidance will have on our financial statements.
39
3. Balance Sheet Information
Supplemental information on our year-end consolidated balance sheets is as follows:
|
(In millions) |
|
2019 |
|
|
|
2018 |
|
||
|
Inventories: |
|
|
|
|
|
|
|
|
|
|
Raw materials and supplies |
|
$ |
|
|
|
|
$ |
|
|
|
Work in process |
|
|
|
|
|
|
|
|
|
|
Finished products |
|
|
|
|
|
|
|
|
|
|
Total inventories |
|
$ |
|
|
|
|
$ |
|
|
|
Property, plant and equipment: |
|
|
|
|
|
|
|
|
|
|
Land and improvements |
|
$ |
|
|
|
|
$ |
|
|
|
Buildings and improvements to leaseholds |
|
|
|
|
|
|
|
|
|
|
Machinery and equipment |
|
|
|
|
|
|
|
|
|
|
Construction in progress |
|
|
|
|
|
|
|
|
|
|
Property, plant and equipment, gross |
|
|
|
|
|
|
|
|
|
|
Less: accumulated depreciation |
|
|
|
|
|
|
|
|
|
|
Property, plant and equipment, net of accumulated depreciation |
|
$ |
|
|
|
|
$ |
|
|
|
Other current liabilities: |
|
|
|
|
|
|
|
|
|
|
Accrued salaries, wages and other compensation |
|
$ |
|
|
|
|
$ |
|
|
|
Accrued customer programs |
|
|
|
|
|
|
|
|
|
|
Accrued taxes |
|
|
|
|
|
|
|
|
|
|
Dividends payable |
|
|
|
|
|
|
|
|
|
|
Other accrued expenses |
|
|
|
|
|
|
|
|
|
|
Total other current liabilities |
|
$ |
|
|
|
|
$ |
|
|
4. Acquisitions and Dispositions
In September 2018, we acquired
The following table summarizes the final allocation of the purchase price to the fair value of assets acquired and liabilities assumed as of the date of the acquisition.
|
(In millions) |
|
|||
|
Accounts receivable |
|
$ |
|
|
|
Inventories |
|
|
|
|
|
Property, plant and equipment |
|
|
|
|
|
Goodwill |
|
|
|
|
|
Identifiable intangible assets |
|
|
|
|
|
Other assets |
|
|
|
|
|
Total assets |
|
|
|
|
|
Accounts payable |
|
|
|
|
|
Other liabilities and accruals |
|
|
|
|
|
Net assets acquired |
|
$ |
|
|
Goodwill includes expected sales and cost synergies. Identifiable intangible assets primarily consist of customer relationships and tradenames.
40
In October 2017, we acquired Victoria+Albert, a UK-based premium brand of standalone bathtubs, sinks, tub fillers, faucets and other accessories. In July 2017, we acquired Shaws, a UK-based luxury plumbing products company that specializes in manufacturing and selling fireclay sinks and selling brassware and accessories. The total combined consideration paid was approximately $
In April 2017, we completed the sale of Field ID, our cloud-based inspection and safety compliance software product line included in our Doors & Security segment. We recorded a pre-tax loss of $
5. Discontinued Operations
In the twelve months ended December 31, 2018 and 2017, the loss on discontinued operations of $
6. Goodwill and Identifiable Intangible Assets
We had goodwill of $
|
(In millions) |
|
Cabinets |
|
|
|
Plumbing |
|
|
|
Doors & Security |
|
|
|
Total Goodwill |
|
||||
|
Balance at December 31, 2017(a) |
|
$ |
|
|
|
|
$ |
|
|
|
|
$ |
|
|
|
|
$ |
|
|
|
2018 translation adjustments |
|
|
( |
) |
|
|
|
( |
) |
|
|
|
( |
) |
|
|
|
( |
) |
|
Acquisition-related adjustments |
|
|
— |
|
|
|
|
|
|
|
|
|
|
|
|
|
|
|
|
|
Balance at December 31, 2018(a) |
|
$ |
|
|
|
|
$ |
|
|
|
|
$ |
|
|
|
|
$ |
|
|
|
2019 translation adjustments |
|
|
|
|
|
|
|
|
|
|
|
|
|
|
|
|
|
|
|
|
Acquisition-related adjustments |
|
|
— |
|
|
|
|
— |
|
|
|
|
|
|
|
|
|
|
|
|
Balance at December 31, 2019(a) |
|
$ |
|
|
|
|
$ |
|
|
|
|
$ |
|
|
|
|
$ |
|
|
|
(a) |
|
We also had identifiable intangible assets, principally tradenames and customer relationships, of $
The gross carrying value and accumulated amortization by class of intangible assets as of December 31, 2019 and 2018 were as follows:
|
|
|
|
As of December 31, 2019 |
|
|
|
As of December 31, 2018 |
|
||||||||||||||||||
|
(In millions) |
|
|
Gross Carrying Amounts |
|
|
Accumulated Amortization |
|
|
Net Book Value |
|
|
|
Gross Carrying Amounts |
|
|
Accumulated Amortization |
|
|
Net Book Value |
|
||||||
|
Indefinite-lived tradenames |
|
|
$ |
|
|
|
$ |
— |
|
|
$ |
|
|
|
|
$ |
|
|
|
$ |
— |
|
|
$ |
|
|
|
Amortizable intangible assets |
|
|
|
|
|
|
|
|
|
|
|
|
|
|
|
|
|
|
|
|
|
|
|
|
|
|
|
Tradenames |
|
|
|
|
|
|
|
( |
) |
|
|
|
|
|
|
|
|
|
|
|
( |
) |
|
|
|
|
|
Customer and contractual relationships |
|
|
|
|
|
|
|
( |
) |
|
|
|
|
|
|
|
|
|
|
|
( |
) |
|
|
|
|
|
Patents/proprietary technology |
|
|
|
|
|
|
|
( |
) |
|
|
|
|
|
|
|
|
|
|
|
( |
) |
|
|
|
|
|
Total |
|
|
|
|
|
|
|
( |
) |
|
|
|
|
|
|
|
|
|
|
|
( |
) |
|
|
|
|
|
Total identifiable intangibles |
|
|
$ |
|
|
|
$ |
( |
) |
|
$ |
|
|
|
|
$ |
|
|
|
$ |
( |
) |
|
$ |
|
|
Amortizable intangible assets, principally customer relationships, are subject to amortization on a straight-line basis over their estimated useful life, ranging from
41
|
In the fourth quarter of 2019, we recognized an impairment charge of $ |
|
|
|
In the third quarter of 2019, we recognized an impairment charge of $ |
|
|
|
During the third quarter of 2018, we recorded a pre-tax impairment charge of $ |
|
|
|
The fair values of the impaired tradenames were measured using the relief-from-royalty approach, which estimates the present value of royalty income that could be hypothetically earned by licensing the tradename to a third party over its remaining useful life. Some of the more significant assumptions inherent in estimating the fair values include forecasted revenue growth rates for the tradename, assumed royalty rate, and a market-participant discount rate that reflects the level of risk associated with the tradenames’ future revenues and profitability. We selected the assumptions used in the financial forecasts using historical data, supplemented by current and anticipated market conditions, estimated growth rates, and management plans. These assumptions represent level 3 inputs of the fair value hierarchy (refer to Note 11). |
|
|
|
A reduction in the estimated fair value of these |
7. Leases
As discussed in Note 2, we adopted ASU 2016-02 as of January 1, 2019. We have operating and finance leases for buildings and certain machinery and equipment. Operating leases are included in operating lease assets, other current liabilities, and operating lease liabilities in our consolidated balance sheets. Amounts recognized for finance leases as of and for the year ended December 31, 2019 were immaterial.
Operating lease expense recognized in the consolidated statement of comprehensive income for the year ended December 31, 2019 was $
Other information related to leases was as follows:
|
(In millions, except lease term and discount rate) |
|
December 31, 2019 |
|
|
|
Cash paid for amounts included in the measurement of lease liabilities: |
|
|
|
|
|
Operating cash flows from operating leases |
|
$ |
|
|
|
Right-of-use assets obtained in exchange for operating lease obligations |
|
$ |
|
|
|
Weighted average remaining lease term - operating leases |
|
|
|
|
|
Weighted average discount rate - operating leases |
|
|
|
% |
42
Total lease payments under non-cancellable operating leases as of December 31, 2019 were as follows:
|
(In millions) |
|
|
|
|
|
Year Ending December 31, |
|
|
|
|
|
2020 |
|
$ |
|
|
|
2021 |
|
|
|
|
|
2022 |
|
|
|
|
|
2023 |
|
|
|
|
|
2024 |
|
|
|
|
|
Thereafter |
|
|
|
|
|
Total lease payments |
|
|
|
|
|
Less imputed interest |
|
|
( |
) |
|
Total |
|
$ |
|
|
|
Reported as of December 31, 2019 |
|
|
|
|
|
Other current liabilities |
|
$ |
|
|
|
Operating lease liabilities |
|
|
|
|
|
Total |
|
$ |
|
|
8. Asset Impairment Charges
In January 2017, we committed to a plan to sell Field ID, our cloud-based inspection and safety compliance software product line included in our Doors & Security segment. In accordance with FASB Accounting Standards Codification (“ASC”) 360, as a result of our decision to sell, during the first quarter of 2017 we recorded $
9. External Debt and Financing Arrangements
Unsecured Senior Notes
At December 31, 2019, the Company had aggregate outstanding notes in the principal amount of $
|
(in millions) |
|
|
|
|
|
|
|
|
Net Carrying Value |
|
|||||
|
Coupon Rate |
Principal Amount |
|
|
Issuance Date |
|
Maturity Date |
|
December 31, 2019 |
|
|
December 31, 2018 |
|
|||
|
3.000% Senior Notes |
$ |
|
|
|
|
|
|
|
$ |
|
|
|
$ |
|
|
|
4.000% Senior Notes |
|
|
|
|
|
|
|
|
|
|
|
|
|
|
|
|
4.000% Senior Notes (the “2018 Notes”) |
|
|
|
|
|
|
|
|
|
|
|
|
|
|
|
|
3.250% Senior Notes (the “2019 Notes”) |
|
|
|
|
|
|
|
|
|
|
|
|
|
— |
|
|
Total Senior Notes |
$ |
|
|
|
|
|
|
|
$ |
|
|
|
$ |
|
|
In September 2019, we issued $
In September 2018, we issued $
Notes payments during the next five years as of December 31, 2019 are $
43
Credit Facilities
In September 2019, the Company entered into a second amended and restated $
We currently have uncommitted bank lines of credit in China, which provide for unsecured borrowings for working capital of up to $
The components of long-term debt were as follows:
|
(In millions) |
|
2019 |
|
|
|
2018 |
|
||
|
Notes |
|
$ |
|
|
|
|
$ |
|
|
|
$ |
|
|
— |
|
|
|
|
|
|
|
Term Loan (due |
|
|
— |
|
|
|
|
|
|
|
Total debt |
|
|
|
|
|
|
|
|
|
|
Less: current portion |
|
|
|
|
|
|
|
|
|
|
Total long-term debt |
|
$ |
|
|
|
|
$ |
|
|
In our debt agreements, there are normal and customary events of default which would permit the lenders to accelerate the debt if not cured within applicable grace periods, such as failure to pay principal or interest when due or a change in control of the Company. There were no events of default as of December 31, 2019.
10. Financial Instruments
We do not enter into financial instruments for trading or speculative purposes. We principally use financial instruments to reduce the impact of changes in foreign currency exchange rates and commodities used as raw materials in our products. The principal derivative financial instruments we enter into on a routine basis are foreign exchange contracts. Derivative financial instruments are recorded at fair value. The counterparties to derivative contracts are major financial institutions. We are subject to credit risk on these contracts equal to the fair value of these instruments. Management currently believes that the risk of incurring material losses is unlikely and that the losses, if any, would be immaterial to the Company.
Raw materials used by the Company are subject to price volatility caused by weather, supply conditions, geopolitical and economic variables, and other unpredictable external factors. As a result, from time to time, we enter into commodity swaps to manage the price risk associated with forecasted purchases of materials used in our operations. We account for these commodity derivatives as economic hedges or cash flow hedges. Changes in the fair value of economic hedges are recorded directly into current period earnings. There were no material commodity swap contracts outstanding for the years ended December 31, 2019 and 2018.
We enter into foreign exchange contracts primarily to hedge forecasted sales and purchases denominated in select foreign currencies, thereby limiting currency risk that would otherwise result from changes in exchange rates. The periods of the foreign exchange contracts correspond to the periods of the forecasted transactions, which generally do not exceed 12 to
44
For derivative instruments that are designated as fair value hedges, the gain or loss on the derivative instrument, as well as the offsetting loss or gain on the hedged item, are recognized on the same line of the statement of income. The changes in the fair value of cash flow hedges are reported in other comprehensive income (“OCI”) and are recognized in the statement of income when the hedged item affects earnings. The changes in fair value for net investment hedges are recognized in the statement of income when realized upon sale or upon complete or substantially complete liquidation of the investment in the foreign entity. In addition, changes in the fair value of all economic hedge transactions are immediately recognized in current period earnings. Our primary foreign currency hedge contracts pertain to the Canadian dollar, the British pound, the Chinese yuan and the Mexican peso. The gross U.S. dollar equivalent notional amount of all foreign currency derivative hedges outstanding at December 31, 2019 was $
The fair values of foreign exchange and commodity derivative instruments on the consolidated balance sheets as of December 31, 2019 and 2018 were:
|
|
|
|
|
|
Fair Value |
|
||||||
|
(In millions) |
|
Location |
|
|
2019 |
|
|
|
2018 |
|
||
|
Assets: |
|
|
|
|
|
|
|
|
|
|
|
|
|
Foreign exchange contracts |
|
Other current assets |
|
|
$ |
|
|
|
|
$ |
|
|
|
Commodity contracts |
|
Other current assets |
|
|
|
|
|
|
|
|
— |
|
|
Net investment hedges |
|
Other current assets |
|
|
|
— |
|
|
|
|
|
|
|
|
|
Total assets |
|
|
$ |
|
|
|
|
$ |
|
|
|
Liabilities: |
|
|
|
|
|
|
|
|
|
|
|
|
|
Foreign exchange contracts |
|
Other current liabilities |
|
|
$ |
|
|
|
|
$ |
|
|
|
Net investment hedges |
|
Other current liabilities |
|
|
|
|
|
|
|
|
— |
|
|
|
|
Total liabilities |
|
|
$ |
|
|
|
|
$ |
|
|
45
The effects of derivative financial instruments on the consolidated statements of income in 2019, 2018 and 2017 were:
|
(In millions) |
|
Classification and Amount of Gain (Loss) Recognized in Income on Fair Value and Cash Flow Hedging Relationships |
|
|||||||||
|
|
|
2019 |
|
|||||||||
|
|
|
Cost of products sold |
|
|
Interest expense |
|
|
Other expense, net |
|
|||
|
Total amounts per Consolidated Statements of Income |
|
$ |
|
|
|
$ |
|
|
|
$ |
|
|
|
The effects of fair value and cash flow hedging: |
|
|
|
|
|
|
|
|
|
|
|
|
|
Gain (loss) on fair value hedging relationships |
|
|
|
|
|
|
|
|
|
|
|
|
|
Foreign exchange contracts: |
|
|
|
|
|
|
|
|
|
|
|
|
|
Hedged items |
|
|
|
|
|
|
|
|
|
|
|
|
|
Derivative designated as hedging instruments |
|
|
|
|
|
|
|
|
|
|
( |
) |
|
Gain (loss) on cash flow hedging relationships |
|
|
|
|
|
|
|
|
|
|
|
|
|
Foreign exchange contracts: |
|
|
|
|
|
|
|
|
|
|
|
|
|
Amount of gain or (loss) reclassified from accumulated other comprehensive (loss) income into income |
|
|
|
|
|
|
|
|
|
|
|
|
|
Commodity contracts: |
|
|
|
|
|
|
|
|
|
|
|
|
|
Amount of gain or (loss) reclassified from accumulated other comprehensive (loss) income into income |
|
|
( |
) |
|
|
|
|
|
|
|
|
|
Interest rate contracts: |
|
|
|
|
|
|
|
|
|
|
|
|
|
Amount of gain or (loss) reclassified from accumulated other comprehensive (loss) income into income |
|
|
|
|
|
|
|
|
|
|
|
|
|
|
|
|
|
|
|
|
|
|
|
|
|
|
|
(In millions) |
|
Classification and Amount of Gain (Loss) Recognized in Income on Fair Value and Cash Flow Hedging Relationships |
|
|||||||||
|
|
|
2018 |
|
|||||||||
|
|
|
Cost of products sold |
|
|
Interest expense |
|
|
Other income, net |
|
|||
|
Total amounts per Consolidated Statements of Income |
|
$ |
|
|
|
$ |
|
|
|
$ |
|
|
|
The effects of fair value and cash flow hedging: |
|
|
|
|
|
|
|
|
|
|
|
|
|
Gain (loss) on fair value hedging relationships |
|
|
|
|
|
|
|
|
|
|
|
|
|
Foreign exchange contracts: |
|
|
|
|
|
|
|
|
|
|
|
|
|
Hedged items |
|
|
|
|
|
|
|
|
|
|
( |
) |
|
Derivative designated as hedging instruments |
|
|
|
|
|
|
|
|
|
|
|
|
|
Gain (loss) on cash flow hedging relationships |
|
|
|
|
|
|
|
|
|
|
|
|
|
Foreign exchange contracts: |
|
|
|
|
|
|
|
|
|
|
|
|
|
Amount of gain or (loss) reclassified from accumulated other comprehensive (loss) income into income |
|
|
|
|
|
|
|
|
|
|
|
|
|
Commodity contracts: |
|
|
|
|
|
|
|
|
|
|
|
|
|
Amount of gain or (loss) reclassified from accumulated other comprehensive (loss) income into income |
|
|
( |
) |
|
|
|
|
|
|
|
|
|
Interest rate contracts: |
|
|
|
|
|
|
|
|
|
|
|
|
|
Amount of gain or (loss) reclassified from accumulated other comprehensive (loss) income into income |
|
|
|
|
|
|
|
|
|
|
|
|
46
|
(In millions) |
|
Classification and Amount of Gain (Loss) Recognized in Income on Fair Value and Cash Flow Hedging Relationships |
|
|||||||||
|
|
|
2017 |
|
|||||||||
|
|
|
Cost of products sold |
|
|
Interest expense |
|
|
Other income, net |
|
|||
|
Total amounts per Consolidated Statements of Income |
|
$ |
|
|
|
$ |
|
|
|
$ |
|
|
|
The effects of fair value and cash flow hedging: |
|
|
|
|
|
|
|
|
|
|
|
|
|
Gain (loss) on fair value hedging relationships |
|
|
|
|
|
|
|
|
|
|
|
|
|
Foreign exchange contracts: |
|
|
|
|
|
|
|
|
|
|
|
|
|
Hedged items |
|
|
|
|
|
|
|
|
|
|
|
|
|
Derivative designated as hedging instruments |
|
|
|
|
|
|
|
|
|
|
( |
) |
|
Gain (loss) on cash flow hedging relationships |
|
|
|
|
|
|
|
|
|
|
|
|
|
Foreign exchange contracts: |
|
|
|
|
|
|
|
|
|
|
|
|
|
Amount of gain or (loss) reclassified from accumulated other comprehensive (loss) income into income |
|
|
|
|
|
|
|
|
|
|
|
|
|
Commodity contracts: |
|
|
|
|
|
|
|
|
|
|
|
|
|
Amount of gain or (loss) reclassified from accumulated other comprehensive (loss) income into income |
|
|
|
|
|
|
|
|
|
|
|
|
|
Interest rate contracts: |
|
|
|
|
|
|
|
|
|
|
|
|
|
Amount of gain or (loss) reclassified from accumulated other comprehensive (loss) income into income |
|
|
|
|
|
|
- |
|
|
|
|
|
The cash flow hedges recognized in other comprehensive income were net gains (losses) of $
11. Fair Value Measurements
ASC requirements for Fair Value Measurements and Disclosures establish a fair value hierarchy that prioritizes the inputs to valuation techniques used to measure fair value into three levels. Level 1 inputs, the highest priority, are quoted prices in active markets for identical assets or liabilities. Level 2 inputs reflect other than quoted prices included in level 1 that are either observable directly or through corroboration with observable market data. Level 3 inputs are unobservable inputs due to little or
The carrying value and fair value of debt as of December 31, 2019 and 2018 were as follows:
|
(In millions) |
|
December 31, 2019 |
|
|
December 31, 2018 |
|
||||||||||
|
|
|
Carrying Value |
|
|
Fair Value |
|
|
Carrying Value |
|
|
Fair Value |
|
||||
|
Revolving credit facility |
|
$ |
— |
|
|
$ |
— |
|
|
$ |
|
|
|
$ |
|
|
|
Term Loan |
|
|
— |
|
|
|
— |
|
|
|
|
|
|
|
|
|
|
Senior Notes, net of underwriting commissions and price discounts |
|
|
|
|
|
|
|
|
|
|
|
|
|
1,490.4 |
|
|
The estimated fair value of our term loan and revolving credit facility is determined primarily using broker quotes, which are level 2 inputs. The estimated fair value of our Senior Notes is determined by using quoted market prices of our debt securities, which are level 1 inputs.
47
Assets and liabilities measured at fair value on a recurring basis as of December 31, 2019 and 2018 were as follows:
|
(In millions) |
|
Fair Value |
|
||||||
|
|
|
2019 |
|
|
|
2018 |
|
||
|
Assets: |
|
|
|
|
|
|
|
|
|
|
Derivative asset financial instruments (level 2) |
|
$ |
|
|
|
|
$ |
|
|
|
Deferred compensation program assets (level 2) |
|
|
|
|
|
|
|
|
|
|
Total assets |
|
$ |
|
|
|
|
$ |
|
|
|
Liabilities: |
|
|
|
|
|
|
|
|
|
|
Derivative liability financial instruments (level 2) |
|
$ |
|
|
|
|
$ |
|
|
The principal derivative financial instruments we enter into on a routine basis are foreign exchange contracts. In addition, from time to time, we enter into commodity swaps. Derivative financial instruments are recorded at fair value.
12. Capital Stock
The Company has
|
|
|
Common Shares |
|
|
|
Treasury Shares |
|
||||||||||||
|
|
|
2019 |
|
|
|
2018 |
|
|
|
2019 |
|
|
|
2018 |
|
||||
|
Balance at the beginning of the year |
|
|
|
|
|
|
|
|
|
|
|
|
|
|
|
|
|
|
|
|
Stock plan shares issued |
|
|
|
|
|
|
|
|
|
|
|
|
— |
|
|
|
|
— |
|
|
Shares surrendered by optionees |
|
|
( |
) |
|
|
|
( |
) |
|
|
|
|
|
|
|
|
|
|
|
Common stock repurchases |
|
|
( |
) |
|
|
|
( |
) |
|
|
|
|
|
|
|
|
|
|
|
Balance at the end of the year |
|
|
|
|
|
|
|
|
|
|
|
|
|
|
|
|
|
|
|
At December 31, 2019,
In 2019, we repurchased
In December 2019, our Board of Directors declared a cash dividend of $
48
13. Accumulated Other Comprehensive (Loss) Income
The reclassifications out of accumulated other comprehensive (loss) income for the years ended December 31, 2019 and 2018 were as follows:
|
(In millions) |
|
|
|
|
|
|
|
|
|
|
|
Details about Accumulated Other Comprehensive Income Components |
|
Affected Line Item in the Consolidated Statements of Income |
||||||||
|
|
|
2019 |
|
|
2018 |
|
|
|
||
|
Gains (losses) on cash flow hedges |
|
|
|
|
|
|
|
|
|
|
|
Foreign exchange contracts |
|
$ |
|
|
|
$ |
|
|
|
Cost of products sold |
|
Interest rate contracts |
|
|
|
|
|
|
|
|
|
Interest expense |
|
Commodity contracts |
|
|
( |
) |
|
|
( |
) |
|
Cost of products sold |
|
|
|
|
|
|
|
|
|
|
|
Total before tax |
|
|
|
|
( |
) |
|
|
( |
) |
|
Tax expense |
|
|
|
$ |
|
|
|
$ |
|
|
|
Net of tax |
|
Defined benefit plan items |
|
|
|
|
|
|
|
|
|
|
|
Recognition of actuarial losses |
|
|
( |
) |
|
|
( |
) |
|
(a) |
|
|
|
|
|
|
|
|
|
|
|
Tax expense |
|
|
|
$ |
( |
) |
|
$ |
( |
) |
|
Net of tax |
|
Total reclassifications for the period |
|
$ |
( |
) |
|
$ |
( |
) |
|
Net of tax |
|
(a) |
|
Total accumulated other comprehensive (loss) income consists of net income and other changes in business equity from transactions and other events from sources other than shareholders. It includes currency translation gains and losses, unrealized gains and losses from derivative instruments designated as cash flow hedges, and defined benefit plan adjustments.
|
(In millions) |
|
Foreign Currency Adjustments |
|
|
Derivative Hedging Gain (Loss) |
|
|
Defined Benefit Plan Adjustments |
|
|
|
Accumulated Other Comprehensive (Loss) Income |
|
||||
|
Balance at December 31, 2016 |
|
$ |
( |
) |
|
$ |
( |
) |
|
$ |
( |
) |
|
|
$ |
( |
) |
|
Amounts classified into accumulated other comprehensive (loss) income |
|
|
|
|
|
|
( |
) |
|
|
|
|
|
|
|
|
|
|
Amounts reclassified from accumulated other comprehensive (loss) income into earnings |
|
|
— |
|
|
|
( |
) |
|
|
( |
) |
|
|
|
( |
) |
|
Net current period other comprehensive (loss) income |
|
|
|
|
|
|
( |
) |
|
|
|
|
|
|
|
|
|
|
Balance at December 31, 2017 |
|
$ |
|
|
|
$ |
( |
) |
|
$ |
( |
) |
|
|
$ |
( |
) |
|
Amounts classified into accumulated other comprehensive (loss) income |
|
|
( |
) |
|
|
|
|
|
|
( |
) |
|
|
|
( |
) |
|
Amounts reclassified into earnings |
|
|
— |
|
|
|
( |
) |
|
|
|
|
|
|
|
|
|
|
Net current period other comprehensive (loss) income |
|
|
( |
) |
|
|
|
|
|
|
( |
) |
|
|
|
( |
) |
|
Balance at December 31, 2018 |
|
$ |
( |
) |
|
$ |
|
|
|
$ |
( |
) |
|
|
$ |
( |
) |
|
Amounts classified into accumulated other comprehensive (loss) income |
|
|
|
|
|
|
|
|
|
|
( |
) |
|
|
|
( |
) |
|
Amounts reclassified into earnings |
|
|
— |
|
|
|
( |
) |
|
|
|
|
|
|
|
|
|
|
Adoption of ASU 2018-02 |
|
|
— |
|
|
|
— |
|
|
|
( |
) |
|
|
|
( |
) |
|
Net current period other comprehensive (loss) income |
|
|
|
|
|
|
|
|
|
|
( |
) |
|
|
|
( |
) |
|
Balance at December 31, 2019 |
|
$ |
( |
) |
|
$ |
|
|
|
$ |
( |
) |
|
|
$ |
( |
) |
49
14. Stock-Based Compensation
As of December 31, 2019, we had awards outstanding under
Stock-based compensation expense from continuing operations was as follows:
|
(In millions) |
|
2019 |
|
|
|
2018 |
|
|
|
2017 |
|
|||
|
Stock option awards |
|
$ |
|
|
|
|
$ |
|
|
|
|
$ |
|
|
|
Restricted stock units |
|
|
|
|
|
|
|
|
|
|
|
|
|
|
|
Performance awards |
|
|
|
|
|
|
|
|
|
|
|
|
|
|
|
Director awards |
|
|
|
|
|
|
|
|
|
|
|
|
|
|
|
Total pre-tax expense |
|
|
|
|
|
|
|
|
|
|
|
|
|
|
|
Tax benefit |
|
|
|
|
|
|
|
|
|
|
|
|
|
|
|
Total after tax expense |
|
$ |
|
|
|
|
$ |
|
|
|
|
$ |
|
|
Included in compensation costs are cash-settled restricted stock units of $
Restricted Stock Units
Restricted stock units have been granted to officers and certain employees of the Company and represent the right to receive unrestricted shares of Company common stock subject to continued employment through each vesting date. Restricted stock units generally vest ratably over a period. In addition, certain employees can elect to defer receipt of a portion of their RSU awards upon vesting. Compensation cost is recognized over the service period. We calculate the fair value of each restricted stock unit granted by using the average of the high and low share prices on the date of grant.
A summary of activity with respect to restricted stock units outstanding under the Plans for the year ended December 31, 2019 was as follows:
|
|
|
Number of Restricted Stock Units |
|
|
Weighted-Average Grant-Date Fair Value |
|
||
|
Non-vested at December 31, 2018 |
|
|
|
|
|
$ |
|
|
|
Granted |
|
|
|
|
|
|
|
|
|
Vested |
|
|
( |
) |
|
|
|
|
|
Forfeited |
|
|
( |
) |
|
|
|
|
|
Non-vested at December 31, 2019 |
|
|
|
|
|
$ |
|
|
The remaining unrecognized pre-tax compensation cost related to restricted stock units at December 31, 2019 was approximately $
Stock Option Awards
Stock options were granted to officers and certain employees of the Company and represent the right to purchase shares of Company common stock subject to continued employment through each vesting date. Stock options granted under the Plans generally vest over a period and have a maturity of
All stock-based compensation to employees is required to be measured at fair value and expensed over the requisite service period. We recognize compensation expense on awards on a straight-line basis over the requisite service period for the entire award.
50
The fair value of Fortune Brands options was estimated at the date of grant using a Black-Scholes option pricing model with the assumptions shown in the following table:
|
|
|
|
2019 |
|
|
|
2018 |
|
|
2017 |
|
|
Current expected dividend yield |
|
|
|
|
% |
|
|
|
|
|
|
|
Expected volatility |
|
|
|
|
% |
|
|
|
|
|
|
|
Risk-free interest rate |
|
|
|
|
% |
|
|
|
|
|
|
|
Expected term |
|
|
|
|
|
|
|
|
|
|
|
The determination of expected volatility is based on a blended peer group volatility for companies in similar industries, at a similar stage of life and with similar market capitalization. The risk-free interest rate is based on U.S. government issues with a remaining term equal to the expected life of the stock options. The expected term is the period over which our employees are expected to hold their options. The expected term was determined based on the historical employee exercise behavior and the contractual term of the options. The dividend yield is based on the Company’s estimated dividend over the expected term. The weighted-average grant date fair value of stock options granted under the Plans during the years ended December 31, 2019, 2018 and 2017 was $
A summary of Fortune Brands stock option activity related to Fortune Brands and former employees of Fortune Brands, Inc., the Company from which we spun off from in 2011, for the year ended December 31, 2019 was as follows:
|
|
|
Options |
|
|
Weighted- Average Exercise Price |
|
||
|
Outstanding at December 31, 2018 |
|
|
|
|
|
$ |
|
|
|
Granted |
|
|
|
|
|
|
|
|
|
Exercised |
|
|
( |
) |
|
|
|
|
|
Expired/forfeited |
|
|
( |
) |
|
|
|
|
|
Outstanding at December 31, 2019 |
|
|
|
|
|
$ |
|
|
Options outstanding and exercisable at December 31, 2019 were as follows:
|
|
|
Options Outstanding (a) |
|
|
Options Exercisable (b) |
|
||||||||||||||
|
Range Of Exercise Prices |
|
Options Outstanding |
|
|
Weighted- Average Remaining Contractual Life |
|
|
Weighted- Average Exercise Price |
|
|
Options Exercisable |
|
|
Weighted- Average Exercise Price |
|
|||||
|
13.00 to 20.00 |
|
|
|
|
|
|
|
|
|
|
|
|
|
|
|
|
|
|
|
|
|
20.01 to 65.41 |
|
|
|
|
|
|
|
|
|
|
|
|
|
|
|
|
|
|
|
|
|
|
|
|
|
|
|
|
|
|
|
$ |
|
|
|
|
|
|
|
$ |
|
|
|
(a) |
|
|
(b) |
|
The remaining unrecognized compensation cost related to unvested awards at December 31, 2019 was $
Performance Awards
Performance share awards were granted to officers and certain employees of the Company and represent the right to earn shares of Company common stock based on the achievement of company-wide non-GAAP performance conditions, including cumulative diluted earnings per share, average return on invested capital, average return on net tangible assets and cumulative EBITDA during the three-year performance period. Compensation cost is amortized into expense over the performance period, which is generally three years, and is based on the probability of meeting performance targets. The fair value of each performance share award is based on the average of the high and low stock price on the date of grant.
51
The following table summarizes information about performance share awards as of December 31, 2019, as well as activity during the year then ended. The number of performance share awards granted are shown below at the target award amounts:
|
|
|
Number of Performance Share Awards |
|
|
Weighted-Average Grant-Date Fair Value |
|
||
|
Non-vested at December 31, 2018 |
|
|
|
|
|
$ |
|
|
|
Granted |
|
|
|
|
|
|
|
|
|
Vested |
|
|
( |
) |
|
|
|
|
|
Forfeited |
|
|
( |
) |
|
|
|
|
|
Non-vested at December 31, 2019 |
|
|
|
|
|
$ |
|
|
The remaining unrecognized pre-tax compensation cost related to performance share awards at December 31, 2019 was approximately $
Director Awards
Stock awards are used as part of the compensation provided to outside directors under the Plan. Awards are issued annually in the second quarter. In addition, outside directors can elect to have director fees paid in stock or can elect to defer payment of stock. Compensation cost is expensed at the time of an award based on the fair value of a share at the date of the award. In 2019, 2018 and 2017, we awarded
15. Revenue
Our principal performance obligations are the sale of kitchen and bath cabinets, faucets and accessories, fiberglass and steel entry-door systems and locks, safes, safety, security devices and decking (collectively, “goods” or “products”). We recognize revenue for the sale of goods based on our assessment of when control transfers to our customers. For the majority of our sales, we recognize revenue at the point in time when we ship product from our facilities to our customers. Revenue is measured as the amount of consideration we expect to receive in exchange for transferring goods to our customers.
We record estimates to reduce revenue for customer programs and incentives, which are considered variable consideration, and include price discounts, volume-based incentives, promotions and cooperative advertising when revenue is recognized in order to determine the amount of consideration the Company will ultimately be entitled to receive. These estimates are based on historical and projected experience for each type of customer. In addition, for certain customer program incentives, we receive an identifiable benefit (goods or services) in exchange for the consideration given and record the associated expenditure in selling, general and administrative expenses.
We account for shipping and handling costs that occur after the customer has obtained control of a product as a fulfillment activity (i.e., as an expense) rather than as a promised service (i.e., as a revenue element). These costs are classified within selling, general and administrative expenses.
52
Settlement of our outstanding accounts receivable balances is normally within 30 to 90 days of the original sale transaction date. Obligations arise for us from customer rights to return our goods for any reason, including among others, product obsolescence, stock rotations, trade-in agreements for newer products and upon termination of a customer contract. We estimate future product returns at the time of sale based on historical experience and record a corresponding refund obligation, which amounted to $
The Company disaggregates revenue from contracts with customers into (i) major sales distribution channels in the U.S. and (ii) total sales to customers outside the U.S. market as these categories depict the nature, amount, timing and uncertainty of revenues and cash flows that are affected by economic factors.
|
(In millions) |
|
December 31, 2019 |
|
|
December 31, 2018 |
|
||
|
Wholesalers(a) |
|
$ |
|
|
|
$ |
|
|
|
Home Center retailers(b) |
|
|
|
|
|
|
|
|
|
Other retailers(c) |
|
|
|
|
|
|
|
|
|
Builder direct |
|
|
|
|
|
|
|
|
|
U.S. net sales |
|
|
|
|
|
|
|
|
|
International(d) |
|
|
|
|
|
|
|
|
|
Net sales |
|
$ |
|
|
|
$ |
|
|
|
(a) |
|
|
(b) |
|
|
(c) |
|
|
(d) |
|
Practical Expedients
Incremental costs of obtaining a contract include only those costs the Company incurs that would not have been incurred if the contract had not been obtained. These costs are required to be recognized as assets and amortized over the period that the related goods or services transfer to the customer. As a practical expedient, we expense as incurred costs to obtain a contract when the expected amortization period is one year or less. These costs are recorded within selling, general and administrative expenses.
16. Defined Benefit Plans
We have a number of pension plans in the United States, covering many of the Company’s employees; however, the majority of these plans have been frozen to new participants and benefit accruals were frozen for active participants on December 31, 2016. The plans provide for payment of retirement benefits, mainly commencing between the ages of
Net actuarial gains and losses occur when actual experience differs from any of the assumptions used to value defined benefit plans or when assumptions change as they may each year. The primary factors contributing to actuarial gains and losses are changes in the discount rate used to value obligations as of the measurement date and the differences between expected and actual returns on pension plan assets.
53
In addition, the Company provides postretirement health care and life insurance benefits to certain retirees.
|
(In millions) |
|
|
Pension Benefits |
|
|
|
Postretirement Benefits |
|
||||||||||||
|
Obligations and Funded Status at December 31 |
|
|
2019 |
|
|
|
2018 |
|
|
|
2019 |
|
|
|
2018 |
|
||||
|
Change in the Projected Benefit Obligation (PBO): |
|
|
|
|
|
|
|
|
|
|
|
|
|
|
|
|
|
|
|
|
|
Projected benefit obligation at beginning of year |
|
|
$ |
|
|
|
|
$ |
|
|
|
|
$ |
|
|
|
|
$ |
|
|
|
Service cost |
|
|
|
|
|
|
|
|
|
|
|
|
|
|
|
|
|
|
— |
|
|
Interest cost |
|
|
|
|
|
|
|
|
|
|
|
|
|
|
|
|
|
|
— |
|
|
Plan amendments |
|
|
|
— |
|
|
|
|
— |
|
|
|
|
|
|
|
|
|
— |
|
|
Actuarial loss (gain) |
|
|
|
|
|
|
|
|
( |
) |
|
|
|
|
|
|
|
|
( |
) |
|
Benefits paid |
|
|
|
( |
) |
|
|
|
( |
) |
|
|
|
( |
) |
|
|
|
— |
|
|
Curtailment gain |
|
|
|
— |
|
|
|
|
— |
|
|
|
|
( |
) |
|
|
|
— |
|
|
Projected benefit obligation at end of year |
|
|
$ |
|
|
|
|
$ |
|
|
|
|
$ |
|
|
|
|
$ |
|
|
|
Accumulated benefit obligation at end of year (excludes the impact of future compensation increases) |
|
|
$ |
|
|
|
|
$ |
|
|
|
|
$ |
— |
|
|
|
$ |
— |
|
|
Change in Plan Assets: |
|
|
|
|
|
|
|
|
|
|
|
|
|
|
|
|
|
|
|
|
|
Fair value of plan assets at beginning of year |
|
|
$ |
|
|
|
|
$ |
|
|
|
|
$ |
— |
|
|
|
$ |
— |
|
|
Actual return on plan assets |
|
|
|
|
|
|
|
|
( |
) |
|
|
|
— |
|
|
|
|
— |
|
|
Employer contributions |
|
|
|
|
|
|
|
|
|
|
|
|
|
|
|
|
|
|
— |
|
|
Benefits paid |
|
|
|
( |
) |
|
|
|
( |
) |
|
|
|
( |
) |
|
|
|
— |
|
|
Fair value of plan assets at end of year |
|
|
$ |
|
|
|
|
$ |
|
|
|
|
$ |
— |
|
|
|
$ |
— |
|
|
Funded status (Fair value of plan assets less PBO) |
|
|
$ |
( |
) |
|
|
$ |
( |
) |
|
|
$ |
( |
) |
|
|
$ |
( |
) |
The actuarial loss (gain) is primarily a result of changes in discount rates from year to year.
The accumulated benefit obligation exceeds the fair value of assets for all pension plans.
|
|
|
Pension Benefits |
|
|
|
Postretirement Benefits |
|
||||||||||||
|
(In millions) |
|
2019 |
|
|
|
2018 |
|
|
|
2019 |
|
|
|
2018 |
|
||||
|
Current benefit payment liability |
|
$ |
( |
) |
|
|
$ |
( |
) |
|
|
$ |
( |
) |
|
|
$ |
( |
) |
|
Accrued benefit liability |
|
|
( |
) |
|
|
|
( |
) |
|
|
|
( |
) |
|
|
|
( |
) |
|
Net amount recognized |
|
$ |
( |
) |
|
|
$ |
( |
) |
|
|
$ |
( |
) |
|
|
$ |
( |
) |
As of December 31, 2019, we adopted the new Society of Actuaries MP-2019 mortality tables, resulting in an immaterial increase in plan benefit obligation, and deferred actuarial losses in accumulated other comprehensive income. As of December 31, 2018, we adopted the new Society of Actuaries MP-2018 mortality tables, resulting in an immaterial decrease of our pension benefit obligation, and deferred actuarial losses in accumulated other comprehensive income.
The amounts in accumulated other comprehensive loss on the consolidated balance sheets that have not yet been recognized as components of net periodic benefit cost were as follows:
|
(In millions) |
|
Pension Benefits |
|
|
|
Postretirement Benefits |
|
||
|
Net actuarial loss at December 31, 2017 |
|
$ |
|
|
|
|
$ |
— |
|
|
Recognition of actuarial (loss) gain |
|
|
( |
) |
|
|
|
|
|
|
Current year actuarial loss (gain) |
|
|
|
|
|
|
|
( |
) |
|
Net actuarial loss (gain) at December 31, 2018 |
|
$ |
|
|
|
|
$ |
( |
) |
|
Recognition of actuarial (loss) gain |
|
|
( |
) |
|
|
|
( |
) |
|
Current year actuarial loss |
|
|
|
|
|
|
|
|
|
|
Net actuarial loss due to curtailment |
|
|
( |
) |
|
|
|
— |
|
|
Net actuarial loss (gain) at December 31, 2019 |
|
$ |
|
|
|
|
$ |
( |
) |
54
Components of net periodic benefit cost were as follows:
|
Components of Net Periodic Benefit (Income) Cost |
|
Pension Benefits |
|
|
|
Postretirement Benefits |
|
||||||||||||||||||||
|
(In millions) |
|
2019 |
|
|
|
2018 |
|
|
2017 |
|
|
|
2019 |
|
|
|
2018 |
|
|
2017 |
|
||||||
|
Service cost |
|
$ |
|
|
|
|
$ |
|
|
|
$ |
|
|
|
|
$ |
|
|
|
|
$ |
— |
|
|
$ |
— |
|
|
Interest cost |
|
|
|
|
|
|
|
|
|
|
|
|
|
|
|
|
|
|
|
|
|
— |
|
|
|
— |
|
|
Expected return on plan assets |
|
|
( |
) |
|
|
|
( |
) |
|
|
( |
) |
|
|
|
— |
|
|
|
|
— |
|
|
|
— |
|
|
Recognition of actuarial losses (gains) |
|
|
|
|
|
|
|
|
|
|
|
|
|
|
|
|
|
|
|
|
|
( |
) |
|
|
( |
) |
|
Settlement/Curtailment losses (gains) |
|
|
|
|
|
|
|
— |
|
|
|
— |
|
|
|
|
( |
) |
|
|
|
— |
|
|
|
— |
|
|
Amortization of prior service credits |
|
|
— |
|
|
|
|
— |
|
|
|
— |
|
|
|
|
|
|
|
|
|
— |
|
|
|
( |
) |
|
Net periodic benefit cost (income) |
|
$ |
|
|
|
|
$ |
( |
) |
|
$ |
( |
) |
|
|
$ |
|
|
|
|
$ |
( |
) |
|
$ |
( |
) |
|
Assumptions |
|
Pension Benefits |
|
|
|
Postretirement Benefits |
|
||||||||||||||||||||
|
|
|
2019 |
|
|
|
2018 |
|
|
2017 |
|
|
|
2019 |
|
|
|
2018 |
|
|
2017 |
|
||||||
|
Weighted-Average Assumptions Used to Determine Benefit Obligations at December 31: |
|
|
|
|
|
|
|
|
|
|
|
|
|
|
|
|
|
|
|
|
|
|
|
|
|
|
|
|
Discount rate |
|
|
|
% |
|
|
|
|
% |
|
|
|
% |
|
|
|
|
% |
|
|
|
|
% |
|
|
|
% |
|
Weighted-Average Assumptions Used to Determine Net Cost for Years Ended December 31: |
|
|
|
|
|
|
|
|
|
|
|
|
|
|
|
|
|
|
|
|
|
|
|
|
|
|
|
|
Discount rate |
|
|
|
% |
|
|
|
|
% |
|
|
|
% |
|
|
|
|
% |
|
|
|
|
% |
|
|
|
% |
|
Expected long-term rate of return on plan assets |
|
|
|
% |
|
|
|
|
% |
|
|
|
% |
|
|
|
— |
|
|
|
|
— |
|
|
|
— |
|
|
|
|
Postretirement Benefits |
||||||
|
|
|
2019 |
|
|
|
2018 |
|
|
|
Assumed Health Care Cost Trend Rates Used to Determine Benefit Obligations and Net Cost at December 31: |
|
|
|
|
|
|
|
|
|
Health care cost trend rate assumed for next year |
|
|
% |
(a) |
|
|
% |
(a) |
|
Rate that the cost trend rate is assumed to decline (the ultimate trend rate) |
|
|
% |
|
|
|
% |
|
|
Year that the rate reaches the ultimate trend rate |
|
|
|
|
|
|
|
|
|
(a) |
|
Plan Assets
The fair value of the pension assets by major category of plan assets as of December 31, 2019 and 2018 were as follows:
|
(In millions) |
|
Total as of balance sheet date |
|
|||||
|
|
|
2019 |
|
|
2018 |
|
||
|
Group annuity/insurance contracts (level 3) |
|
$ |
|
|
|
$ |
|
|
|
Collective trusts: |
|
|
|
|
|
|
|
|
|
Cash and cash equivalents |
|
|
|
|
|
|
|
|
|
Equity |
|
|
|
|
|
|
|
|
|
Fixed income |
|
|
|
|
|
|
|
|
|
Multi-strategy hedge funds |
|
|
|
|
|
|
|
|
|
Real estate |
|
|
|
|
|
|
|
|
|
Total |
|
$ |
|
|
|
$ |
|
|
A reconciliation of Level 3 measurements was as follows:
|
|
|
Group annuity/ insurance contracts |
|
||||||
|
(In millions) |
|
2019 |
|
|
|
2018 |
|
||
|
January 1 |
|
$ |
|
|
|
|
$ |
|
|
|
Actual return on assets related to assets still held |
|
|
|
|
|
|
|
|
|
|
December 31 |
|
$ |
|
|
|
|
$ |
|
|
55
Our defined benefit plans Master Trust own a variety of investment assets. All of these investment assets, except for group annuity/insurance contracts are measured using net asset value per share as a practical expedient per ASC 820. Following the retrospective adoption of ASU 2015-07 (Fair Value Measurement (Topic 820): Disclosures for Investments in Certain Entities That Calculate Net Asset Value per Share) we excluded all investments measured using net asset value per share in the amount of $
The terms and conditions for redemptions vary for each class of the investment assets valued at net asset value per share as a practical expedient. Real estate assets may be redeemed quarterly with a
Our investment strategy is to optimize investment returns through a diversified portfolio of investments, taking into consideration underlying plan liabilities and asset volatility. The defined benefit asset allocation policy of the plans allow for an equity allocation of
Our 2020 expected blended long-term rate of return on plan assets of
Estimated Future Retirement Benefit Payments
The following retirement benefit payments are expected to be paid:
|
(In millions) |
|
Pension Benefits |
|
|
|
Postretirement Benefits |
|
||
|
2020 |
|
$ |
|
|
|
|
$ |
|
|
|
2021 |
|
|
|
|
|
|
|
|
|
|
2022 |
|
|
|
|
|
|
|
|
|
|
2023 |
|
|
|
|
|
|
|
|
|
|
2024 |
|
|
|
|
|
|
|
|
|
|
Years 2025-2029 |
|
|
|
|
|
|
|
|
|
Estimated future retirement benefit payments above are estimates and could change significantly based on differences between actuarial assumptions and actual events and decisions related to lump sum distribution options that are available to participants in certain plans.
Defined Contribution Plan Contributions
We sponsor a number of defined contribution plans. Contributions are determined under various formulas. Cash contributions by the Company related to these plans amounted to $
17. Income Taxes
The components of income from continuing operations before income taxes and noncontrolling interests were as follows:
|
(In millions) |
|
|
2019 |
|
|
|
2018 |
|
|
2017 |
|
|||
|
Domestic operations |
|
|
$ |
|
|
|
|
$ |
|
|
|
$ |
|
|
|
Foreign operations |
|
|
|
|
|
|
|
|
|
|
|
|
|
|
|
Income before income taxes and noncontrolling interests |
|
|
$ |
|
|
|
|
$ |
|
|
|
$ |
|
|
56
A reconciliation of income taxes at the
|
(In millions) |
|
|
2019 |
|
|
|
2018 |
|
|
2017 |
|
|||
|
Income tax expense computed at federal statutory income tax rate |
|
|
$ |
|
|
|
|
$ |
|
|
|
$ |
|
|
|
Other income taxes, net of federal tax benefit |
|
|
|
|
|
|
|
|
|
|
|
|
|
|
|
Foreign taxes at a different rate than U.S. federal statutory income tax rate |
|
|
|
|
|
|
|
|
|
|
|
|
( |
) |
|
Tax benefit on income attributable to domestic production activities |
|
|
|
— |
|
|
|
|
— |
|
|
|
( |
) |
|
Net adjustments for uncertain tax positions |
|
|
|
|
|
|
|
|
|
|
|
|
|
|
|
Share-based compensation (ASU 2016-09) |
|
|
|
( |
) |
|
|
|
( |
) |
|
|
( |
) |
|
Tax Act impact |
|
|
|
— |
|
|
|
|
|
|
|
|
( |
) |
|
Deferred tax impact of state tax rate changes |
|
|
|
|
|
|
|
|
|
|
|
|
( |
) |
|
Valuation allowance increase (decrease) |
|
|
|
|
|
|
|
|
|
|
|
|
( |
) |
|
Miscellaneous other, net |
|
|
|
( |
) |
|
|
|
|
|
|
|
( |
) |
|
Income tax expense as reported |
|
|
$ |
|
|
|
|
$ |
|
|
|
$ |
|
|
|
Effective income tax rate |
|
|
|
|
% |
|
|
|
|
% |
|
|
|
% |
The 2019 and 2018 effective income tax rates were favorably impacted by a tax benefit related to share-based compensation and were unfavorably impacted by a valuation allowance increase, state and local taxes, unfavorable tax rates in foreign jurisdictions, and increases in uncertain tax positions. The 2018 effective income tax rate was also unfavorably impacted by an adjustment to the provisional net benefit recorded in 2017 under the Tax Cuts and Jobs Act of 2017 (the “Tax Act”).
The 2017 effective income tax rate was favorably impacted by the Tax Act, a tax benefit related to share-based compensation, the tax benefit attributable to the Domestic Production Activity Deduction and favorable tax rates in foreign jurisdictions, partially offset by state and local taxes and increases to uncertain tax positions.
The Tax Act, enacted on December 22, 2017, made significant changes to the U.S. Internal Revenue Code including a reduction in the corporate tax rate from
A reconciliation of the beginning and ending amount of unrecognized tax benefits (“UTBs”) was as follows:
|
(In millions) |
|
|
2019 |
|
|
|
2018 |
|
|
2017 |
|
|||
|
Unrecognized tax benefits—beginning of year |
|
|
$ |
|
|
|
|
$ |
|
|
|
$ |
|
|
|
Gross additions—current year tax positions |
|
|
|
|
|
|
|
|
|
|
|
|
|
|
|
Gross additions—prior year tax positions |
|
|
|
|
|
|
|
|
|
|
|
|
|
|
|
Gross additions (reductions)—purchase accounting adjustments |
|
|
|
— |
|
|
|
|
|
|
|
|
|
|
|
Gross reductions—prior year tax positions |
|
|
|
( |
) |
|
|
|
( |
) |
|
|
( |
) |
|
Gross reductions—settlements with taxing authorities |
|
|
|
( |
) |
|
|
|
( |
) |
|
|
( |
) |
|
Unrecognized tax benefits—end of year |
|
|
$ |
|
|
|
|
$ |
|
|
|
$ |
|
|
The amount of UTBs that, if recognized as of December 31, 2019, would affect the Company’s effective tax rate was $
We classify interest and penalty accruals related to UTBs as income tax expense. In 2019, we recognized an interest and penalty expense of approximately $
We file income tax returns in the U.S., various state and foreign jurisdictions. The Company is currently under examination by the U.S. Internal Revenue Service for the periods related to 2017 and 2018, and open and subject to examination for 2016. In addition to the U.S., we have tax years that remain open and subject to examination by tax authorities in the following major taxing jurisdictions: Canada for years after 2014, Mexico for years after 2014 and China for years after 2015.
57
Income taxes in 2019, 2018 and 2017 were as follows:
|
(In millions) |
|
|
2019 |
|
|
|
2018 |
|
|
2017 |
|
|||
|
Current |
|
|
|
|
|
|
|
|
|
|
|
|
|
|
|
Federal |
|
|
$ |
|
|
|
|
$ |
|
|
|
$ |
|
|
|
Foreign |
|
|
|
|
|
|
|
|
|
|
|
|
|
|
|
State and other |
|
|
|
|
|
|
|
|
|
|
|
|
|
|
|
Deferred |
|
|
|
|
|
|
|
|
|
|
|
|
|
|
|
Federal, state and other |
|
|
|
( |
) |
|
|
|
|
|
|
|
( |
) |
|
Foreign |
|
|
|
( |
) |
|
|
|
( |
) |
|
|
|
|
|
Total income tax expense |
|
|
$ |
|
|
|
|
$ |
|
|
|
$ |
|
|
The components of net deferred tax assets (liabilities) as of December 31, 2019 and 2018 were as follows:
|
(In millions) |
|
|
2019 |
|
|
|
2018 |
|
||
|
Deferred tax assets: |
|
|
|
|
|
|
|
|
|
|
|
Compensation and benefits |
|
|
$ |
|
|
|
|
$ |
|
|
|
Defined benefit plans |
|
|
|
|
|
|
|
|
|
|
|
Capitalized inventories |
|
|
|
|
|
|
|
|
|
|
|
Accounts receivable |
|
|
|
|
|
|
|
|
|
|
|
Other accrued expenses |
|
|
|
|
|
|
|
|
|
|
|
Net operating loss and other tax carryforwards |
|
|
|
|
|
|
|
|
|
|
|
Valuation allowance |
|
|
|
( |
) |
|
|
|
( |
) |
|
Miscellaneous |
|
|
|
|
|
|
|
|
|
|
|
Total deferred tax assets |
|
|
|
|
|
|
|
|
|
|
|
Deferred tax liabilities: |
|
|
|
|
|
|
|
|
|
|
|
Fixed assets |
|
|
|
( |
) |
|
|
|
( |
) |
|
Intangible assets |
|
|
|
( |
) |
|
|
|
( |
) |
|
Investment in partnership |
|
|
|
( |
) |
|
|
|
( |
) |
|
Miscellaneous |
|
|
|
( |
) |
|
|
|
( |
) |
|
Total deferred tax liabilities |
|
|
|
( |
) |
|
|
|
( |
) |
|
Net deferred tax liability |
|
|
$ |
( |
) |
|
|
$ |
( |
) |
In accordance with ASC requirements for Income Taxes, deferred taxes were classified in the consolidated balance sheets as of December 31, 2019 and 2018 as follows:
|
(In millions) |
|
|
2019 |
|
|
|
2018 |
|
||
|
Other assets |
|
|
|
|
|
|
|
|
|
|
|
Deferred income taxes |
|
|
|
( |
) |
|
|
|
( |
) |
|
Net deferred tax liability |
|
|
$ |
( |
) |
|
|
$ |
( |
) |
As of December 31, 2019 and 2018, the Company had deferred tax assets relating to net operating losses, capital losses, and other tax carryforwards of $
The Company has provided a valuation allowance to reduce the carrying value of certain of these deferred tax assets, as management has concluded that, based on the available evidence, it is more likely than not that the deferred tax assets will not be fully realized.
Under the Tax Act, the accumulated foreign earnings and profits of the Company’s foreign subsidiaries as of December 31, 2017 are subject to a deemed repatriation tax and should not be subject to additional U.S. federal income tax upon an actual repatriation of those earnings. As a result, the Company has recorded an estimated tax liability of $
We have not provided for deferred taxes on the remaining book over tax outside basis differences of our foreign subsidiaries. The outside basis differences of foreign subsidiaries considered indefinitely reinvested totaled approximately $
58
18. Restructuring and Other Charges
Pre-tax restructuring and other charges for the year ended December 31, 2019 were as follows:
|
|
|
Year Ended December 31, 2019 |
|
|||||||||||||||
|
|
|
|
|
|
|
|
Other Charges (a) |
|
|
|
|
|
|
|||||
|
(In millions) |
|
Restructuring Charges |
|
|
|
Cost of Products Sold |
|
|
SG&A(b) |
|
|
|
Total Charges |
|
||||
|
Cabinets |
|
$ |
|
|
|
|
$ |
( |
) |
|
$ |
|
|
|
|
$ |
|
|
|
Plumbing |
|
|
|
|
|
|
|
|
|
|
|
|
|
|
|
|
|
|
|
Doors & Security |
|
|
|
|
|
|
|
|
|
|
|
— |
|
|
|
|
|
|
|
Total |
|
$ |
|
|
|
|
$ |
|
|
|
$ |
|
|
|
|
$ |
|
|
|
(a) |
|
|
(b) |
|
Restructuring and other charges in 2019 largely related to severance costs and costs associated with closing facilities across all of our segments.
Pre-tax restructuring and other charges for the year ended December 31, 2018 were as follows:
|
|
|
Year Ended December 31, 2018 |
|
|||||||||||||||
|
|
|
|
|
|
|
|
Other Charges (a) |
|
|
|
|
|
|
|||||
|
(In millions) |
|
Restructuring Charges |
|
|
|
Cost of Products Sold |
|
|
SG&A(b) |
|
|
|
Total Charges |
|
||||
|
Cabinets |
|
$ |
|
|
|
|
$ |
|
|
|
$ |
|
|
|
|
$ |
|
|
|
Plumbing |
|
|
|
|
|
|
|
|
|
|
|
|
|
|
|
|
|
|
|
Doors & Security |
|
|
|
|
|
|
|
|
|
|
|
( |
) |
|
|
|
|
|
|
Total |
|
$ |
|
|
|
|
$ |
|
|
|
$ |
( |
) |
|
|
$ |
|
|
|
(a) |
|
|
(b) |
Selling, general and administrative expenses |
Restructuring and other charges in 2018 are largely related to our initiatives to consolidate and rationalize our manufacturing footprint and discontinue certain product lines in our Cabinets segment and severance costs within all our segments.
Pre-tax restructuring and other charges for the year ended December 31, 2017 were as follows:
|
|
|
Year Ended December 31, 2017 |
|
|||||||||||||||
|
|
|
|
|
|
|
|
Other Charges (a) |
|
|
|
|
|
|
|||||
|
(In millions) |
|
Restructuring Charges |
|
|
|
Cost of Products Sold |
|
|
SG&A(b) |
|
|
|
Total Charges |
|
||||
|
Cabinets |
|
$ |
|
|
|
|
$ |
|
|
|
$ |
|
|
|
|
$ |
|
|
|
Plumbing |
|
|
|
|
|
|
|
— |
|
|
|
— |
|
|
|
|
|
|
|
Doors & Security |
|
|
|
|
|
|
|
|
|
|
|
|
|
|
|
|
|
|
|
Total |
|
$ |
|
|
|
|
$ |
|
|
|
$ |
|
|
|
|
$ |
|
|
|
(a) |
“Other Charges” represent charges or gains directly related to restructuring initiatives that cannot be reported as restructuring under GAAP. Such charges or gains may include losses on disposal of inventories, trade receivables allowances from exiting product lines, accelerated depreciation resulting from the closure of facilities, and gains and losses on the sale of previously closed facilities. |
|
(b) |
Selling, general and administrative expenses |
Restructuring and other charges in 2017 primarily related to losses on disposal of inventory associated with exiting a product line in our Doors & Security segment and exiting a customer relationship in our Cabinets segment, as well as severance costs within all of our segments.
59
Reconciliation of Restructuring Liability
|
(In millions) |
|
Balance at 12/31/18 |
|
|
2019 Provision |
|
|
Cash Expenditures (a) |
|
|
Non-Cash Write-offs |
|
|
Balance at 12/31/19 |
|
|||||
|
Workforce reduction costs |
|
$ |
|
|
|
$ |
|
|
|
$ |
( |
) |
|
$ |
( |
) |
|
$ |
|
|
|
Other |
|
|
|
|
|
|
|
|
|
|
( |
) |
|
|
( |
) |
|
|
|
|
|
|
|
$ |
|
|
|
$ |
|
|
|
$ |
( |
) |
|
$ |
( |
) |
|
$ |
|
|
|
(a) |
|
|
(In millions) |
|
Balance at 12/31/17 |
|
|
2018 Provision |
|
|
Cash Expenditures (a) |
|
|
Non-Cash Write-offs |
|
|
Balance at 12/31/18 |
|
|||||
|
Workforce reduction costs |
|
$ |
|
|
|
$ |
|
|
|
$ |
( |
) |
|
$ |
( |
) |
|
$ |
|
|
|
Other |
|
|
|
|
|
|
|
|
|
|
( |
) |
|
|
( |
) |
|
|
|
|
|
|
|
$ |
|
|
|
$ |
|
|
|
$ |
( |
) |
|
$ |
( |
) |
|
$ |
|
|
|
(a) |
Cash expenditures primarily related to severance charges. |
19. Commitments
Purchase Obligations
Purchase obligations of the Company as of December 31, 2019 were $
Lease Commitments
Future minimum rental payments under non-cancelable operating leases as of December 31, 2018 were as follows:
|
(In millions) |
|
|||
|
2019 |
|
$ |
|
|
|
2020 |
|
|
|
|
|
2021 |
|
|
|
|
|
2022 |
|
|
|
|
|
2023 |
|
|
|
|
|
Remainder |
|
|
|
|
|
Total minimum rental payments |
|
$ |
|
|
Total rental expense for all operating leases (reduced by immaterial amounts from subleases) amount to $
Product Warranties
We generally record warranty expense related to contractual warranty terms at the time of sale. We may also provide customer concessions for claims made outside of the contractual warranty terms and those expenses are recorded in the period in which the concession is made. We offer our customers various warranty terms based on the type of product that is sold. Warranty expense is determined based on historic claim experience and the nature of the product category.
|
(In millions) |
|
2019 |
|
|
|
2018 |
|
|
2017 |
|
|||
|
Reserve balance at the beginning of the year |
|
$ |
|
|
|
|
$ |
|
|
|
$ |
|
|
|
Provision for warranties issued |
|
|
|
|
|
|
|
|
|
|
|
|
|
|
Settlements made (in cash or in kind) |
|
|
( |
) |
|
|
|
( |
) |
|
|
( |
) |
|
Acquisition |
|
|
— |
|
|
|
|
|
|
|
|
— |
|
|
Foreign currency |
|
|
|
|
|
|
|
( |
) |
|
|
|
|
|
Reserve balance at end of year |
|
$ |
|
|
|
|
$ |
|
|
|
$ |
|
|
60
20. Information on Business Segments
We report our operating segments based on how operating results are regularly reviewed by our chief operating decision maker for making decisions about resource allocations to segments and assessing performance. The Company’s operating segments and types of products from which each segment derives revenues are described below.
The Cabinets segment includes custom, semi-custom and stock cabinetry for the kitchen, bath and other parts of the home under brand names including Aristokraft, Diamond, Mid-Continent, Kitchen Craft, Homecrest, Omega, StarMark, Ultracraft, Kemper, Schrock, Decora and Mantra. In addition, cabinets are distributed under the Thomasville Cabinetry brand names. The Plumbing segment manufactures or assembles and sells faucets, bath furnishings, accessories and kitchen sinks and waste disposals predominantly under the Moen, Riobel, ROHL, Victoria+Albert, Perrin & Rowe and Shaws brands. The Doors & Security segment includes residential fiberglass and steel entry door systems under the Therma-Tru brand name, urethane millwork product lines under the Fypon brand name, locks, safety and security devices and electronic security products under the Master Lock and American Lock brand names, fire resistant safes, security containers and commercial cabinets under the SentrySafe brand name and composite decking and railing under the Fiberon brand name. Corporate expenses consist of headquarters administrative expenses and defined benefit plans costs, primarily interest costs and expected return on plan assets, as well as actuarial gains and losses arising from the periodic remeasurement of our liabilities. Corporate assets consist primarily of cash.
The Company’s subsidiaries operate principally in the United States, Canada, Mexico, China and Western Europe.
|
(In millions) |
|
2019 |
|
|
|
2018 |
|
|
|
2017 |
|
|||
|
Net sales: |
|
|
|
|
|
|
|
|
|
|
|
|
|
|
|
Cabinets |
|
$ |
|
|
|
|
$ |
|
|
|
|
$ |
|
|
|
Plumbing |
|
|
|
|
|
|
|
|
|
|
|
|
|
|
|
Doors & Security |
|
|
|
|
|
|
|
|
|
|
|
|
|
|
|
Net sales |
|
$ |
|
|
|
|
$ |
|
|
|
|
$ |
|
|
Net sales to
|
(In millions) |
|
2019 |
|
|
|
2018 |
|
|
|
2017 |
|
|||
|
Operating income: |
|
|
|
|
|
|
|
|
|
|
|
|
|
|
|
Cabinets |
|
$ |
|
|
|
|
$ |
|
|
|
|
$ |
|
|
|
Plumbing |
|
|
|
|
|
|
|
|
|
|
|
|
|
|
|
Doors & Security |
|
|
|
|
|
|
|
|
|
|
|
|
|
|
|
Less: Corporate expenses (a) |
|
|
( |
) |
|
|
|
( |
) |
|
|
|
( |
) |
|
Operating income |
|
$ |
|
|
|
|
$ |
|
|
|
|
$ |
|
|
(a) Below is a table detailing Corporate expenses:
|
General and administrative expense |
|
$ |
( |
) |
|
|
$ |
( |
) |
|
|
$ |
( |
) |
|
Long-lived asset impairment |
|
|
— |
|
|
|
|
— |
|
|
|
|
( |
) |
|
Total Corporate expenses |
|
$ |
( |
) |
|
|
$ |
( |
) |
|
|
$ |
( |
) |
61
|
(In millions) |
|
2019 |
|
|
|
2018 |
|
|
|
2017 |
|
|||
|
Total assets: |
|
|
|
|
|
|
|
|
|
|
|
|
|
|
|
Cabinets |
|
$ |
|
|
|
|
$ |
|
|
|
|
$ |
|
|
|
Plumbing |
|
|
|
|
|
|
|
|
|
|
|
|
|
|
|
Doors & Security |
|
|
|
|
|
|
|
|
|
|
|
|
|
|
|
Corporate |
|
|
|
|
|
|
|
|
|
|
|
|
|
|
|
Total assets |
|
$ |
|
|
|
|
$ |
|
|
|
|
$ |
|
|
|
Depreciation expense: |
|
|
|
|
|
|
|
|
|
|
|
|
|
|
|
Cabinets |
|
$ |
|
|
|
|
$ |
|
|
|
|
$ |
|
|
|
Plumbing |
|
|
|
|
|
|
|
|
|
|
|
|
|
|
|
Doors & Security |
|
|
|
|
|
|
|
|
|
|
|
|
|
|
|
Corporate |
|
|
|
|
|
|
|
|
|
|
|
|
|
|
|
Depreciation expense |
|
$ |
|
|
|
|
$ |
|
|
|
|
$ |
|
|
|
Amortization of intangible assets: |
|
|
|
|
|
|
|
|
|
|
|
|
|
|
|
Cabinets |
|
$ |
|
|
|
|
$ |
|
|
|
|
$ |
|
|
|
Plumbing |
|
|
|
|
|
|
|
|
|
|
|
|
|
|
|
Doors & Security |
|
|
|
|
|
|
|
|
|
|
|
|
|
|
|
Amortization of intangible assets |
|
$ |
|
|
|
|
$ |
|
|
|
|
$ |
|
|
|
Capital expenditures: |
|
|
|
|
|
|
|
|
|
|
|
|
|
|
|
Cabinets |
|
$ |
|
|
|
|
$ |
|
|
|
|
$ |
|
|
|
Plumbing |
|
|
|
|
|
|
|
|
|
|
|
|
|
|
|
Doors & Security |
|
|
|
|
|
|
|
|
|
|
|
|
|
|
|
Corporate |
|
|
|
|
|
|
|
|
|
|
|
|
|
|
|
Capital expenditures, gross |
|
|
|
|
|
|
|
|
|
|
|
|
|
|
|
Less: proceeds from disposition of assets |
|
|
( |
) |
|
|
|
( |
) |
|
|
|
( |
) |
|
Capital expenditures, net |
|
$ |
|
|
|
|
$ |
|
|
|
|
$ |
|
|
|
Net sales by geographic region (a): |
|
|
|
|
|
|
|
|
|
|
|
|
|
|
|
United States |
|
$ |
|
|
|
|
$ |
|
|
|
|
$ |
|
|
|
Canada |
|
|
|
|
|
|
|
|
|
|
|
|
|
|
|
China |
|
|
|
|
|
|
|
|
|
|
|
|
|
|
|
Other international |
|
|
|
|
|
|
|
|
|
|
|
|
|
|
|
Net sales |
|
$ |
|
|
|
|
$ |
|
|
|
|
$ |
|
|
|
Property, plant and equipment, net: |
|
|
|
|
|
|
|
|
|
|
|
|
|
|
|
United States |
|
$ |
|
|
|
|
$ |
|
|
|
|
$ |
|
|
|
Mexico |
|
|
|
|
|
|
|
|
|
|
|
|
|
|
|
Canada |
|
|
|
|
|
|
|
|
|
|
|
|
|
|
|
China |
|
|
|
|
|
|
|
|
|
|
|
|
|
|
|
Other international |
|
|
|
|
|
|
|
|
|
|
|
|
|
|
|
Property, plant and equipment, net |
|
$ |
|
|
|
|
$ |
|
|
|
|
$ |
|
|
|
(a) |
|
62
21. Quarterly Financial Data
|
Unaudited |
|
|
|
|
|
|
|
|
|
|
|
|
|
|
|
|
|
|
|
|
|
|
(In millions, except per share amounts) |
|
|
|
|
|
|
|
|
|
|
|
|
|
|
|
|
|
|
|
|
|
|
|
|
|
|
|
|
|
|
|
|
|
|
|
|
|
|
|
|
|
|
|
|
|
2019 |
|
1st |
|
|
2nd |
|
|
3rd |
|
|
4th |
|
|
|
Full Year |
|
|||||
|
Net sales |
|
$ |
|
|
|
$ |
|
|
|
$ |
|
|
|
$ |
|
|
|
|
$ |
|
|
|
Gross profit |
|
|
|
|
|
|
|
|
|
|
|
|
|
|
|
|
|
|
|
|
|
|
Operating income |
|
|
|
|
|
|
|
|
|
|
|
|
|
|
|
|
|
|
|
|
|
|
Income from continuing operations, net of tax |
|
|
|
|
|
|
|
|
|
|
|
|
|
|
|
|
|
|
|
|
|
|
Income (loss) from discontinued operations, net of tax |
|
|
— |
|
|
|
— |
|
|
|
— |
|
|
|
— |
|
|
|
|
— |
|
|
Net income |
|
|
|
|
|
|
|
|
|
|
|
|
|
|
|
|
|
|
|
|
|
|
Net income attributable to Fortune Brands |
|
|
|
|
|
|
|
|
|
|
|
|
|
|
|
|
|
|
|
|
|
|
Basic earnings (loss) per common share |
|
|
|
|
|
|
|
|
|
|
|
|
|
|
|
|
|
|
|
|
|
|
Continuing operations |
|
|
|
|
|
|
|
|
|
|
|
|
|
|
|
|
|
|
|
|
|
|
Discontinued operations |
|
|
— |
|
|
|
— |
|
|
|
— |
|
|
|
— |
|
|
|
|
— |
|
|
Net income attributable to Fortune Brands |
|
|
|
|
|
|
|
|
|
|
|
|
|
|
|
|
|
|
|
|
|
|
Diluted earnings (loss) per common share |
|
|
|
|
|
|
|
|
|
|
|
|
|
|
|
|
|
|
|
|
|
|
Continuing operations |
|
|
|
|
|
|
|
|
|
|
|
|
|
|
|
|
|
|
|
|
|
|
Discontinued operations |
|
|
— |
|
|
|
— |
|
|
|
— |
|
|
|
— |
|
|
|
|
— |
|
|
Net income attributable to Fortune Brands |
|
|
|
|
|
|
|
|
|
|
|
|
|
|
|
|
|
|
|
|
|
|
2018 |
|
1st |
|
|
2nd |
|
|
3rd |
|
|
4th |
|
|
|
Full Year |
|
|||||
|
Net sales |
|
$ |
|
|
|
$ |
|
|
|
$ |
|
|
|
$ |
|
|
|
|
$ |
|
|
|
Gross profit |
|
|
|
|
|
|
|
|
|
|
|
|
|
|
|
|
|
|
|
|
|
|
Operating income |
|
|
|
|
|
|
|
|
|
|
|
|
|
|
|
|
|
|
|
|
|
|
Income from continuing operations, net of tax |
|
|
|
|
|
|
|
|
|
|
|
|
|
|
|
|
|
|
|
|
|
|
Income (loss) from discontinued operations, net of tax |
|
|
( |
) |
|
|
— |
|
|
|
— |
|
|
|
— |
|
|
|
|
( |
) |
|
Net income |
|
|
|
|
|
|
|
|
|
|
|
|
|
|
|
|
|
|
|
|
|
|
Net income attributable to Fortune Brands |
|
|
|
|
|
|
|
|
|
|
|
|
|
|
|
|
|
|
|
|
|
|
Basic earnings (loss) per common share |
|
|
|
|
|
|
|
|
|
|
|
|
|
|
|
|
|
|
|
|
|
|
Continuing operations |
|
|
|
|
|
|
|
|
|
|
|
|
|
|
|
|
|
|
|
|
|
|
Discontinued operations |
|
|
— |
|
|
|
— |
|
|
|
— |
|
|
|
— |
|
|
|
|
— |
|
|
Net income attributable to Fortune Brands |
|
|
|
|
|
|
|
|
|
|
|
|
|
|
|
|
|
|
|
|
|
|
Diluted earnings (loss) per common share |
|
|
|
|
|
|
|
|
|
|
|
|
|
|
|
|
|
|
|
|
|
|
Continuing operations |
|
|
|
|
|
|
|
|
|
|
|
|
|
|
|
|
|
|
|
|
|
|
Discontinued operations |
|
|
— |
|
|
|
— |
|
|
|
— |
|
|
|
— |
|
|
|
|
— |
|
|
Net income attributable to Fortune Brands |
|
|
|
|
|
|
|
|
|
|
|
|
|
|
|
|
|
|
|
|
|
In 2019, we recorded pre-tax defined benefit plan actuarial loss of $
In 2018, we recorded pre-tax defined benefit plan actuarial loss of $
63
22. Earnings Per Share
The computations of earnings (loss) per common share were as follows:
|
(In millions, except per share data) |
|
2019 |
|
|
|
2018 |
|
|
2017 |
|
|||
|
Income from continuing operations, net of tax |
|
$ |
|
|
|
|
$ |
|
|
|
$ |
|
|
|
Less: Noncontrolling interests |
|
|
( |
) |
|
|
|
|
|
|
|
|
|
|
Income from continuing operations for EPS |
|
|
|
|
|
|
|
|
|
|
|
|
|
|
Income (loss) from discontinued operations |
|
|
— |
|
|
|
|
( |
) |
|
|
( |
) |
|
Net income attributable to Fortune Brands |
|
$ |
|
|
|
|
$ |
|
|
|
$ |
|
|
|
Earnings (loss) per common share |
|
|
|
|
|
|
|
|
|
|
|
|
|
|
Basic |
|
|
|
|
|
|
|
|
|
|
|
|
|
|
Continuing operations |
|
$ |
|
|
|
|
$ |
|
|
|
$ |
|
|
|
Discontinued operations |
|
|
— |
|
|
|
|
— |
|
|
|
( |
) |
|
Net income attributable to Fortune Brands common stockholders |
|
$ |
|
|
|
|
$ |
|
|
|
$ |
|
|
|
Diluted |
|
|
|
|
|
|
|
|
|
|
|
|
|
|
Continuing operations |
|
$ |
|
|
|
|
$ |
|
|
|
$ |
|
|
|
Discontinued operations |
|
|
— |
|
|
|
|
— |
|
|
|
( |
) |
|
Net income attributable to Fortune Brands common stockholders |
|
$ |
|
|
|
|
$ |
|
|
|
$ |
|
|
|
Basic average shares outstanding(a) |
|
|
|
|
|
|
|
|
|
|
|
|
|
|
Stock-based awards |
|
|
|
|
|
|
|
|
|
|
|
|
|
|
Diluted average shares outstanding(a) |
|
|
|
|
|
|
|
|
|
|
|
|
|
|
Antidilutive stock-based awards excluded from weighted-average number of shares outstanding for diluted earnings per share |
|
|
|
|
|
|
|
|
|
|
|
|
|
(a)
23. Other Expense (Income), Net
The components of other expense (income), net for the years ended December 31, 2019, 2018 and 2017 were as follows:
|
(In millions) |
|
2019 |
|
|
|
2018 |
|
|
2017 |
|
|||
|
Defined benefit plan |
|
$ |
|
|
|
|
$ |
( |
) |
|
$ |
( |
) |
|
Asset impairment charge |
|
|
— |
|
|
|
|
— |
|
|
|
|
|
|
Foreign currency (gains)/losses |
|
|
( |
) |
|
|
|
( |
) |
|
|
|
|
|
Ineffective portion of cash flow hedge |
|
|
— |
|
|
|
|
( |
) |
|
|
— |
|
|
Other items, net |
|
|
( |
) |
|
|
|
( |
) |
|
|
— |
|
|
Total other expense (income), net |
|
$ |
|
|
|
|
$ |
( |
) |
|
$ |
( |
) |
In January 2019, we adopted ASU 2017-12, which eliminates the requirement to separately measure and report hedge ineffectiveness and generally requires the entire change in the fair value of a hedging instrument to be presented in the same income statement line as the hedged item. In the year ended December 31, 2018, the ineffective portion of cash flow hedges recognized was $
During 2017, we recorded an impairment charge of $
64
24. Contingencies
Litigation
The Company is a defendant in lawsuits that are ordinary routine litigation matters incidental to its businesses. It is not possible to predict the outcome of the pending actions, and, as with any litigation, it is possible that these actions could be decided unfavorably to the Company. The Company believes that there are meritorious defenses to these actions and that these actions will not have a material adverse effect upon the Company’s results of operations, cash flows or financial condition, and, where appropriate, these actions are being vigorously contested. Accordingly, the Company believes the likelihood of material loss is remote.
Environmental
Compliance with federal, state and local laws regulating the discharge of materials into the environment, or otherwise relating to the protection of the environment, did not have a material effect on capital expenditures, earnings or the competitive position of Fortune Brands. We are involved in remediation activities to clean up hazardous wastes as required by federal and state laws. Liabilities for remediation costs of each site are based on our best estimate of undiscounted future costs, excluding possible insurance recoveries or recoveries from other third parties. Uncertainties about the status of laws, regulations, technology and information related to individual sites make it difficult to develop estimates of future environmental remediation exposures. Some of the potential liabilities relate to sites we own, and some relate to sites we no longer own or never owned. Several of our subsidiaries have been designated as potentially responsible parties (“PRP”) under “Superfund” or similar state laws. As of December 31, 2019, ten such instances have not been dismissed, settled or otherwise resolved. In 2019, none of our subsidiaries were identified as a PRP in a new instance and no instances were settled, dismissed or otherwise resolved. In most instances where our subsidiaries are named as a PRP, we enter into cost-sharing arrangements with other PRPs. We give notice to insurance carriers of potential PRP liability, but very rarely, if ever, receive reimbursement from insurance for PRP costs. We believe that the cost of complying with the present environmental protection laws, before considering estimated recoveries either from other PRPs or insurance, will not have a material adverse effect on our results of operations, cash flows or financial condition. At December 31, 2019 and 2018, we had accruals of $
65
Report of Independent Registered Public Accounting Firm
To the Board of Directors and Shareholders of Fortune Brands Home & Security, Inc.
Opinions on the Financial Statements and Internal Control over Financial Reporting
We have audited the accompanying consolidated balance sheets of Fortune Brands Home & Security, Inc. and its subsidiaries (the “Company”) as of December 31, 2019 and 2018, and the related consolidated statements of income, of comprehensive income, of equity and of cash flows for each of the three years in the period ended December 31, 2019, including the related notes and schedule of valuation and qualifying accounts for each of the three years in the period ended December 31, 2019 appearing after the signature page (collectively referred to as the “consolidated financial statements”). We also have audited the Company's internal control over financial reporting as of December 31, 2019, based on criteria established in Internal Control - Integrated Framework (2013) issued by the Committee of Sponsoring Organizations of the Treadway Commission (COSO).
In our opinion, the consolidated financial statements referred to above present fairly, in all material respects, the financial position of the Company as of December 31, 2019 and 2018, and the results of its operations and its cash flows for each of the three years in the period ended December 31, 2019 in conformity with accounting principles generally accepted in the United States of America. Also in our opinion, the Company maintained, in all material respects, effective internal control over financial reporting as of December 31, 2019, based on criteria established in Internal Control - Integrated Framework (2013) issued by the COSO.
Change in Accounting Principle
As discussed in Note 2 to the consolidated financial statements, the Company changed the manner in which it accounts for leases in 2019.
Basis for Opinions
The Company's management is responsible for these consolidated financial statements, for maintaining effective internal control over financial reporting, and for its assessment of the effectiveness of internal control over financial reporting, included in Management’s Report on Internal Control Over Financial Reporting appearing under Item 9A. Our responsibility is to express opinions on the Company’s consolidated financial statements and on the Company's internal control over financial reporting based on our audits. We are a public accounting firm registered with the Public Company Accounting Oversight Board (United States) (PCAOB) and are required to be independent with respect to the Company in accordance with the U.S. federal securities laws and the applicable rules and regulations of the Securities and Exchange Commission and the PCAOB.
We conducted our audits in accordance with the standards of the PCAOB. Those standards require that we plan and perform the audits to obtain reasonable assurance about whether the consolidated financial statements are free of material misstatement, whether due to error or fraud, and whether effective internal control over financial reporting was maintained in all material respects.
Our audits of the consolidated financial statements included performing procedures to assess the risks of material misstatement of the consolidated financial statements, whether due to error or fraud, and performing procedures that respond to those risks. Such procedures included examining, on a test basis, evidence regarding the amounts and disclosures in the consolidated financial statements. Our audits also included evaluating the accounting principles used and significant estimates made by management, as well as evaluating the overall presentation of the consolidated financial statements. Our audit of internal control over financial reporting included obtaining an understanding of internal control over financial reporting, assessing the risk that a material weakness exists, and testing and evaluating the design and operating effectiveness of internal control based on the assessed risk. Our audits also included performing such other procedures as we considered necessary in the circumstances. We believe that our audits provide a reasonable basis for our opinions.
Definition and Limitations of Internal Control over Financial Reporting
A company’s internal control over financial reporting is a process designed to provide reasonable assurance regarding the reliability of financial reporting and the preparation of financial statements for external purposes in accordance with generally accepted accounting principles. A company’s internal control over financial reporting includes those policies and procedures that (i) pertain to the maintenance of records that, in reasonable detail, accurately and fairly reflect the transactions and dispositions of the assets of the company; (ii) provide reasonable assurance that transactions are recorded as necessary to permit preparation of financial statements in accordance with generally accepted accounting principles, and that receipts and expenditures of the company are being made only in accordance with authorizations of management and directors of the company; and (iii) provide reasonable assurance regarding prevention or timely detection of unauthorized acquisition, use, or disposition of the company’s assets that could have a material effect on the financial statements.
66
Because of its inherent limitations, internal control over financial reporting may not prevent or detect misstatements. Also, projections of any evaluation of effectiveness to future periods are subject to the risk that controls may become inadequate because of changes in conditions, or that the degree of compliance with the policies or procedures may deteriorate.
Critical Audit Matters
The critical audit matter communicated below is a matter arising from the current period audit of the consolidated financial statements that was communicated or required to be communicated to the audit committee and that (i) relates to accounts or disclosures that are material to the consolidated financial statements and (ii) involved our especially challenging, subjective, or complex judgments. The communication of critical audit matters does not alter in any way our opinion on the consolidated financial statements, taken as a whole, and we are not, by communicating the critical audit matter below, providing a separate opinion on the critical audit matter or on the accounts or disclosures to which it relates.
Indefinite-Lived Intangible Asset Impairment Assessment for Tradenames in the Cabinets Segment Where Fair Value Exceeds Carrying Value by Less Than 10%
As described in Notes 2 and 6 to the consolidated financial statements, the Company’s consolidated indefinite-lived intangible asset balance was $635.6 million as of December 31, 2019. The carrying values of the three tradenames in the Cabinets segment where fair value exceeds carrying value by less than 10% are $38.6 million, $85.0 million and $39.1 million, after impairment charges of $12.0 million, $29.5 million and zero recorded during the year to the tradenames, respectively. Management reviews indefinite-lived tradename intangible assets for impairment annually in the fourth quarter and whenever market or business events indicate there may be a potential impairment of that intangible. Impairment losses are recorded to the extent that the carrying value of the indefinite-lived intangible asset exceeds its fair value. Fair value is measured by management using the standard relief-from-royalty approach. Management’s fair value calculation included estimates and assumptions relating to forecasted revenue growth rates, the assumed royalty rates and the market-participant discount rates.
The principal considerations for our determination that performing procedures relating to the indefinite-lived intangible asset impairment assessment for tradenames in the Cabinets segment where fair value exceeds carrying value by less than 10% is a critical audit matter are there was significant judgment by management when developing the fair value measurement of the tradenames. This in turn led to a high degree of auditor judgment, subjectivity, and effort in performing procedures to evaluate management’s fair value calculation and significant assumptions, including the forecasted revenue growth rates, the assumed royalty rates, and the market-participant discount rates. In addition, the audit effort involved the use of professionals with specialized skill and knowledge to assist in performing these procedures and evaluating the audit evidence obtained.
Addressing the matter involved performing procedures and evaluating audit evidence in connection with forming our overall opinion on the consolidated financial statements. These procedures included testing the effectiveness of controls relating to management’s indefinite-lived intangible asset impairment assessments, including controls over the relief-from-royalty valuation of the Company’s indefinite-lived intangible assets. These procedures also included, among others, (i) testing management’s process for developing the fair value estimates of tradenames in the Cabinets segment where fair value exceeds carrying value by less than 10% using the relief-from-royalty approach, (ii) evaluating the appropriateness of the relief-from-royalty approach, (iii) testing the completeness, accuracy, and relevance of underlying data used in the relief-from-royalty approach, and (iv) evaluating the significant assumptions used by management, including the forecasted revenue growth rates, the assumed royalty rates, and the market-participant discount rates. Evaluating management’s assumptions related to the forecasted revenue growth rates involved evaluating whether the assumptions used by management were reasonable considering (i) the current and past performance of the tradenames, (ii) the consistency with external market and industry data, and (iii) whether these assumptions were consistent with evidence obtained in other areas of the audit. Professionals with specialized skill and knowledge were used to assist in the evaluation of the relief-from-royalty approach and certain significant assumptions, including the assumed royalty rates and market-participant discount rates.
/s/ PricewaterhouseCoopers LLP
Chicago, Illinois
February 26, 2020
We have served as the Company’s auditor since 2011.
67
Item 9. Changes in and Disagreements With Accountants on Accounting and Financial Disclosure.
None.
Item 9A. Controls and Procedures.
|
(a) |
Evaluation of Disclosure Controls and Procedures. |
The Company’s management has evaluated, with the participation of the Company’s Chief Executive Officer and Chief Financial Officer, the effectiveness of the Company’s disclosure controls and procedures (as defined in Rules 13a-15(e) and 15d-15(e) under the Exchange Act) as of the end of the period covered by this report. Based on that evaluation, the Chief Executive Officer and the Chief Financial Officer have concluded that the Company’s disclosure controls and procedures were effective as of December 31, 2019.
|
(b) |
Management’s Report on Internal Control Over Financial Reporting. |
Our management is responsible for establishing and maintaining adequate internal control over financial reporting, as such term is defined in Exchange Act Rule 13a-15(f) and 15d-15(f). Under the supervision and with the participation of our management, including our principal executive officer and principal financial officer, we conducted an evaluation of the effectiveness of our internal control over financial reporting based on the framework in Internal Control — Integrated Framework (2013) issued by the Committee of Sponsoring Organization of the Treadway Commission (“COSO”). Based on our evaluation under the framework in Internal Control — Integrated Framework (2013) issued by the COSO, our management concluded that our internal control over financial reporting was effective as of December 31, 2019.
PricewaterhouseCoopers LLP, the Company’s independent public accounting firm, has audited the effectiveness of the Company’s internal control over financial reporting as of December 31, 2019, as stated in their report which appears herein.
|
(c) |
Changes in Internal Control Over Financial Reporting. |
There have not been any changes in the Company’s internal control over financial reporting that occurred during the Company’s fiscal quarter ended December 31, 2019 that have materially affected, or are reasonably likely to materially affect, the Company’s internal control over financial reporting.
Item 9B. Other Information.
None.
68
PART III
Item 10. Directors, Executive Officers and Corporate Governance.
See the information under the captions “Election of Directors,” “Corporate Governance - Board Committees — Audit Committee” and “Delinquent Section 16(a) Reports” contained in the 2020 Proxy Statement, which information is incorporated herein by reference. See the information under the caption “Information about our Executive Officers” contained in Part I of this Annual Report on Form 10-K.
The Company’s Board of Directors has adopted a Code of Business Conduct & Ethics which sets forth various policies and procedures intended to promote the ethical behavior of all of the Company’s employees. The Company’s Board of Directors has also adopted a Code of Ethics for Senior Financial Officers that applies to the Company’s principal executive officer, principal financial officer and principal accounting officer. The Code of Business Conduct & Ethics and the Code of Ethics for Senior Financial Officers are available, free of charge, on the Company’s website, http://ir.fbhs.com/governing-high-standards. A copy of these documents is also available and will be sent to stockholders free of charge upon written request to the Company’s Secretary. Any amendment to, or waiver from, the provisions of the Code of Business Conduct & Ethics or the Code of Ethics for Senior Financial Officers that applies to any of those officers will be posted to the same location on the Company’s website.
Item 11. Executive Compensation.
See the information under the captions “Director Compensation,” “Corporate Governance - Board Committees — Compensation Committee,” “Compensation Committee Interlocks and Insider Participation,” “Compensation Discussion and Analysis,” “Executive Compensation,” “CEO Pay Ratio” and “Compensation Committee Report” contained in the 2020 Proxy Statement, which information is incorporated herein by reference.
Item 12. Security Ownership of Certain Beneficial Owners and Management and Related Stockholder Matters.
See the information under the caption “Certain Information Regarding Security Holdings” contained in the 2020 Proxy Statement, which information is incorporated herein by reference. See also the “Equity Compensation Plan Information” table contained in the 2020 Proxy Statement, which information is incorporated herein by reference.
Item 13. Certain Relationships and Related Transactions, and Director Independence.
See the information under the captions “Director Independence,” “Board Committees,” “Policies with Respect to Transactions with Related Persons” and “Certain Relationships and Related Transactions” contained in the 2020 Proxy Statement, which information is incorporated herein by reference.
Item 14. Principal Accountant Fees and Services.
See the information under the captions “Fees of Independent Registered Public Accounting Firm” and “Approval of Audit and Non-Audit Services” in the 2020 Proxy Statement, which information is incorporated herein by reference.
69
PART IV
Item 15. Exhibits and Financial Statement Schedules
|
(a) |
Financial Statements, Financial Statement Schedules and Exhibits. |
|
(1) |
Financial Statements (all financial statements listed below are of the Company and its consolidated subsidiaries): |
Consolidated Statements of Income for the years ended December 31, 2019, 2018 and 2017 contained in Item 8 hereof.
Consolidated Statements of Comprehensive Income for the years ended December 31, 2019, 2018 and 2017 contained in Item 8 hereof.
Consolidated Balance Sheets as of December 31, 2019 and 2018 contained in Item 8 hereof.
Consolidated Statements of Cash Flows for the years ended December 31, 2019, 2018 and 2017 contained in Item 8 hereof.
Consolidated Statements of Equity for the years ended December 31, 2019, 2018 and 2017 contained in Item 8 hereof.
Notes to Consolidated Financial Statements contained in Item 8 hereof.
Report of Independent Registered Public Accounting Firm contained in Item 8 hereof.
|
(2) |
Financial Statement Schedules |
See Financial Statement Schedule of the Company and subsidiaries at page 74.
|
(3) |
Exhibits |
|
3.1. |
|
|
|
3.2. |
|
|
|
4.1. |
|
|
|
4.2. |
|
|
|
4.3. |
|
|
|
4.4. |
|
|
|
4.5. |
|
|
|
4.6. |
|
|
|
4.7. |
|
|
|
4.8. |
|
|
|
4.9. |
|
|
|
10.1. |
|
70
|
10.2. |
|
|
|
10.3. |
|
|
|
10.4. |
|
|
|
10.5 |
|
|
|
10.6. |
|
|
|
10.7. |
|
|
|
10.8. |
|
|
|
10.9. |
|
|
|
10.10. |
|
|
|
10.11. |
|
|
|
10.12. |
|
|
|
10.13. |
|
|
|
10.14. |
|
|
|
10.15. |
|
|
|
10.16. |
|
|
|
10.17. |
|
|
|
10.18. |
|
|
|
10.19 |
|
|
|
10.20. |
|
|
|
21. |
|
71
|
23. |
|
Consent of Independent Registered Public Accounting Firm, PricewaterhouseCoopers LLP.** |
|
24. |
|
Powers of Attorney relating to execution of this Annual Report on Form 10-K.** |
|
31.1. |
|
|
|
31.2. |
|
|
|
32. |
|
Joint CEO/CFO Certification Required Under Section 906 of the Sarbanes-Oxley Act of 2002.** |
|
101. |
|
The following materials from the Fortune Brands Home & Security, Inc. Annual Report on Form 10‑K for the year ended December 31, 2019 formatted in Inline eXtensible Business Reporting Language (iXBRL): (i) the Consolidated Statements of Income, (ii) the Consolidated Statements of Comprehensive Income (iii) the Consolidated Balance Sheets, (iv) the Consolidated Statements of Cash Flows, (vi) the Consolidated Statements of Equity, and (vi) the Notes to the Consolidated Financial Statements.** |
|
104. |
|
The cover page of the Company’s Annual Report on Form -K for the year ended December 31, 2019, formatted in Inline XBRL and contained in Exhibit 101.** |
|
|
|
|
* |
Indicates the exhibit is a management contract or compensatory plan or arrangement.
|
|
** |
Indicates the exhibit is being filed herewith. |
Item 16. Form 10-K Summary
None.
72
Signatures
Pursuant to the requirements of Section 13 or 15(d) of the Securities Exchange Act of 1934, the Registrant has duly caused this report to be signed on its behalf by the undersigned, thereunto duly authorized.
|
|
|
FORTUNE BRANDS HOME & SECURITY, INC. (The Company) |
|
|
|
|
|
|
|
Date: February 26, 2020 |
|
By: |
|
|
|
|
|
/s/ nicholas i. fink |
|
|
|
|
Nicholas I. Fink |
|
|
|
|
Chief Executive Officer (principal executive officer) |
|
|
|
|
|
|
|
|
|
/s/ patrick d. hallinan |
|
|
|
|
Patrick Hallinan Senior Vice President and Chief Financial Officer (principal financial officer) |
Pursuant to the requirements of the Securities Exchange Act of 1934, this report has been signed below by the following persons on behalf of the Registrant and in the capacities and on the dates indicated.
|
/s/ nicholas i. fink |
|
/s/ susan s. kilsby* |
|
Nicholas I. Fink, Chief Executive Officer and Director (principal executive officer) Date: February 26, 2020 |
|
Susan S. Kilsby, Director Date: February 26, 2020 |
|
|
|
|
|
/s/ christopher j. klein* |
|
/s/ a.d. david mackay* |
|
Christopher J. Klein, Executive Chairman of the Board Date: February 26, 2020 |
|
A.D. David Mackay, Director Date: February 26, 2020 |
|
|
|
|
|
/s/ patrick d. hallinan |
|
/s/ john g. morikis* |
|
Patrick D. Hallinan, Senior Vice President and Chief Financial Officer (principal financial officer) Date: February 26, 2020 |
|
John G. Morikis, Director Date: February 26, 2020 |
|
|
|
|
|
/s/ danny luburic |
|
/s/ david m. thomas* |
|
Danny Luburic, Vice President – Controller (principal accounting officer) Date: February 26, 2020 |
|
David M. Thomas, Director Date: February 26, 2020 |
|
|
|
|
|
/s/ irial finan* |
|
/s/ ronald v. waters, iii* |
|
Irial Finan, Director Date: February 26, 2020 |
|
Ronald V. Waters, III, Director Date: February 26, 2020 |
|
|
|
|
|
/s/ ann fritz hackett* |
|
|
|
Ann Fritz Hackett, Director Date: February 26, 2020 |
|
|
|
*By: |
/s/ Robert K. Biggart |
|
|
Robert K. Biggart, Attorney-in-Fact |
73
Schedule II Valuation and Qualifying Accounts
For the years ended December 31, 2019, 2018 and 2017
|
(In millions) |
|
Balance at Beginning of Period |
|
|
Charged to Expense |
|
|
Reclassifications (c) |
|
|
Write-offs and Deductions (a) |
|
|
Business Acquisition (b) |
|
|
Balance at End of Period |
|
||||||
|
2019: |
|
|
|
|
|
|
|
|
|
|
|
|
|
|
|
|
|
|
|
|
|
|
|
|
|
Allowance for cash discounts and sales allowances |
|
$ |
|
|
|
$ |
|
|
|
$ |
— |
|
|
$ |
|
|
|
$ |
— |
|
|
$ |
|
|
|
Allowance for doubtful accounts |
|
|
|
|
|
|
|
|
|
|
— |
|
|
|
|
|
|
|
— |
|
|
|
|
|
|
Allowance for deferred tax assets |
|
|
|
|
|
|
|
|
|
|
— |
|
|
|
— |
|
|
|
— |
|
|
|
|
|
|
2018: |
|
|
|
|
|
|
|
|
|
|
|
|
|
|
|
|
|
|
|
|
|
|
|
|
|
Allowance for cash discounts and sales allowances |
|
$ |
|
|
|
$ |
|
|
|
$ |
( |
) |
|
$ |
|
|
|
$ |
— |
|
|
$ |
|
|
|
Allowance for doubtful accounts |
|
|
|
|
|
|
|
|
|
|
— |
|
|
|
|
|
|
|
|
|
|
|
|
|
|
Allowance for deferred tax assets |
|
|
|
|
|
|
|
|
|
|
— |
|
|
|
— |
|
|
|
— |
|
|
|
|
|
|
2017: |
|
|
|
|
|
|
|
|
|
|
|
|
|
|
|
|
|
|
|
|
|
|
|
|
|
Allowance for cash discounts, returns and sales allowances |
|
$ |
|
|
|
$ |
|
|
|
$ |
|
|
|
$ |
|
|
|
$ |
— |
|
|
$ |
|
|
|
Allowance for doubtful accounts |
|
|
|
|
|
|
|
|
|
|
— |
|
|
|
|
|
|
|
|
|
|
|
|
|
|
Allowance for deferred tax assets |
|
|
|
|
|
|
( |
) |
|
|
— |
|
|
|
— |
|
|
|
— |
|
|
|
|
|
|
(a) |
|
|
(b) |
|
|
(c) |
|
74
Exhibit 4.1
DESCRIPTION OF SECURITIES REGISTERED PURSUANT TO SECTION 12
OF THE SECURITIES EXCHANGE ACT OF 1934
Overview
The following is a summary of information concerning the common stock of Fortune Brands Home & Security, Inc. (the “Company”, “we”, “us” or “our”), including certain provisions of our restated certificate of incorporation (“our charter”) and our amended and restated bylaws (“our bylaws”) and certain provisions of the Delaware General Corporate Law, as amended (the “DGCL”). The following descriptions do not purport to be complete statements of the relevant provisions of our charter, our bylaws or the DGCL. Our charter and our bylaws are included as Exhibits 3.1 and 3.2 to our Annual Report on Form 10-K.
Authorized Capital Stock
Our authorized capital stock consists of 750,000,000 shares of common stock, par value $0.01 per share, and 60,000,000 shares of preferred stock, par value $0.01 per share.
Dividends. Holders of shares of our common stock are entitled to receive dividends when, as and if declared by our Board of Directors out of funds legally available for that purpose, subject to any preferential rights of holders of any outstanding shares of preferred stock and any other class or series of stock having preference over the common stock as to dividends.
Voting Rights. The holders of our common stock are entitled to one vote for each share held of record on all matters submitted to a vote of our stockholders. In matters other than the election of directors, stockholder approval requires the affirmative vote of a majority of the voting power of our capital stock present in person or represented by proxy at the meeting and entitled to vote on the matter, voting as a single class, unless the matter is one upon which, by express provision of law, our charter or our bylaws, a different vote is required. Except with respect to vacancies or new directorships, directors are elected by the vote of the majority of the votes cast (meaning the number of shares voted “for” a nominee must exceed the number of shares voted “against” such nominee with “abstentions” and “broker non-votes” not counted as a vote cast either “for” or “against” that nominee’s election) at any meeting for the election of directors at which a quorum is present. However, in a contested election of directors, directors are to be elected by a plurality of the votes cast on the election of directors.
In addition to any other vote that may be required by law, applicable stock exchange rule or the terms of any series of our preferred stock, amendments to our certificate of incorporation must be approved by at least a majority of the voting power of all then outstanding shares of capital stock entitled to vote generally in the election of directors, voting as a single class. However, the vote of at least 75% of the voting power of all then outstanding shares of capital stock entitled to vote generally in the election of directors, voting as a single class, is required to amend certain provisions of our charter, including the provisions relating to the classified board of directors, stockholder action by written consent and stockholder amendment of our bylaws.
Our bylaws may be amended by the vote of at least a majority of our Board of Directors or the holders of at least 75% of the voting power of all then outstanding shares of capital stock entitled to vote generally in the election of directors, voting together as a single class.
Other Rights. Subject to the rights of any holders of preferred stock, upon our liquidation, dissolution or winding-up, after payment or provision for payment of our debts and other liabilities, the holders of our common stock are entitled to share ratably in all of our assets available for distribution to our stockholders.
No shares of our common stock are subject to redemption or have preemptive rights to purchase additional shares of our common stock or any other of our securities. There are no subscription rights, conversion rights or sinking fund provisions applicable to our common stock.
Preferred Stock
Our Board of Directors has the authority, without action by our stockholders, to designate and issue our preferred stock in one or more series and to designate the rights, preferences, limitations and privileges of each series of preferred stock, which may be greater than the rights of our common stock. It is not possible to state the actual effect of the issuance of any shares of our preferred stock upon the rights of holders of our common stock
until our Board of Directors determines the specific rights of the holders of our preferred stock. However, the effects of the issuance of any shares of our preferred stock upon the rights of holders of our common stock might include, among other things:
|
|
• |
|
restricting dividends on our common stock, |
|
|
• |
|
diluting the voting power of our common stock, |
|
|
• |
|
impairing the liquidation rights of our common stock and |
|
|
• |
|
delaying or preventing a change in control without further action by our stockholders. |
Certain Provisions of Delaware Law, Our Charter and Our Bylaws
Certain provisions of Delaware law, our charter and our bylaws summarized below may have an anti-takeover effect and may delay, deter or prevent a tender offer or takeover attempt that some stockholders might consider to be in their best interests, including attempts that might result in a premium being paid over the market price for shares of our common stock. These provisions:
|
|
• |
|
encourage potential acquirers to deal directly with our Board of Directors, |
|
|
• |
|
give our Board of Directors the time and leverage to evaluate the fairness of the proposal to all stockholders, |
|
|
• |
|
enhance continuity and stability in the composition of our Board of Directors and in the policies formulated by our Board of Directors and |
|
|
• |
|
discourage certain tactics that may be used in proxy fights. |
Undesignated Preferred Stock. Without any vote or other action by our stockholders, our Board of Directors may designate and issue preferred stock with voting or other rights or preferences that could impede the success of any attempt to change control of the Company. These and other provisions may defer hostile takeovers or delay changes of control of our management.
No Stockholder Action by Written Consent; Special Meetings. Except as otherwise expressly provided by the terms of any series of our preferred stock permitting the holders of such series to act by written consent, any action required or permitted to be taken by our stockholders must be effected at a duly called annual or special meeting of our stockholders, and our charter specifically denies the ability of our stockholders to consent in writing to the taking of any action. Further, our charter and our bylaws provide that special meetings may be called only by the Chairperson of our Board of Directors, our Chief Executive Officer or our Board of Directors.
Requirements for Advance Notification of Stockholder Nomination and Proposals. Our charter requires that advance notice of stockholder nominations for the election of directors and of business to be brought by stockholders before any meeting of our stockholders must be given in the manner provided in our bylaws. To be in proper form, such notice must, among other things, set forth any derivative or hedging positions beneficially held by the proposing or nominating party (or any of its affiliates), the effect or intent of which is to mitigate loss to or manage the risk or benefit of changes in our share price or to change the voting power of such proposing or nominating party (or any of its affiliates) with respect to shares of our common stock. Generally, under our bylaws, to be timely notice must be received at the principal executive offices of the Company not less than 90 days nor more than 120 days prior to the first anniversary of the preceding year’s annual meeting. Notwithstanding the specific provisions of our bylaws, stockholders may request inclusion of proposals in our proxy statement pursuant to Rule 14(a)-8 under the Securities Exchange Act of 1934 or inclusion of nominees in our proxy statement pursuant to other proxy rules adopted by the Securities and Exchange Commission.
Classified Board of Directors. Subject to the rights of holders of any series of our preferred stock with respect to the election of directors, our charter provides for our Board of Directors to be divided into three classes as nearly equal in size as practicable. At each of our annual meetings of stockholders, the successors of the class of directors whose term expires at that meeting of stockholders will be elected for a three-year term, one class being elected each year by our stockholders.
No Stockholder Ability to Fill Director Vacancies. Our charter provides that, subject to the rights of holders of any series of our preferred stock with respect to the election of directors:
|
|
• |
|
the number of directors shall be no less than five and no more than fifteen, and the exact number shall be fixed exclusively by a resolution of the Board of Directors, |
|
|
• |
|
a director may be removed from office by our stockholders only for cause and |
|
|
• |
|
vacancies occurring on our Board of Directors for any reason and newly created directorships resulting from an increase in the number of directors may be filled only by vote of a majority of the remaining members of our Board of Directors. |
No Cumulative Voting. Our charter provides that holders of shares of our common stock are not entitled to cumulate their votes in the election of directors.
Supermajority Requirements. Our charter provides that, in addition to any other vote that may be required by law, applicable stock exchange rule or the terms of any series of preferred stock, a vote of at least 75% of the voting power of all then outstanding shares of capital stock entitled to vote generally in the election of directors, voting together as a single class is required to adopt, amend or repeal certain provisions of our charter. In addition, our bylaws may only be amended by either the vote of at least a majority of our Board of Directors or the vote of at least 75% of the voting power of all then outstanding shares of capital stock entitled to vote generally in the election of directors, voting together as a single class.
Delaware Takeover Statute. Our charter does not exempt the application of Section 203 of the DGCL, an anti-takeover law.
In general, Section 203 prohibits a publicly-held Delaware corporation from engaging in a business combination with an interested stockholder for a period of three years following the date on which the person became an interested stockholder, unless the business combination or the transaction in which the person became an interested stockholder is approved in a prescribed manner. Generally, a “business combination” includes a merger, asset or stock sale, or other transaction resulting in a financial benefit to the interested stockholder, and, generally, an “interested stockholder” is a person that, together with its affiliates and associates, owns 15% or more of the corporation’s voting stock.
Exhibit 10.13
FORTUNE BRANDS HOME & SECURITY, INC.
2013 LONG-TERM INCENTIVE PLAN
Form of [GRANT DATE] Stock Option Agreement (the “Agreement”)
[Vesting Schedule]
Fortune Brands Home & Security, Inc., a Delaware corporation (the “Company”), grants to the undersigned “Optionee” an option to purchase shares of Common Stock from the Company subject to the terms and conditions of the Fortune Brands Home & Security, Inc. 2013 Long-Term Incentive Plan (the “Plan”), the Award Notice (“Award Notice”), and this Agreement (collectively, the “Award”). Capitalized terms not defined in this Agreement have the meanings specified in the Plan.
1. Option Subject to Acceptance of Agreement. The date of grant (the “Award Date”), the number and class of shares of Common Stock subject to the Option and the purchase price per share (the “Exercise Price”) are set forth in the Award Notice and in the Plan’s online administrative system. The Option will be null and void unless Optionee accepts this Agreement in a timely manner through the acceptance process prescribed by the Company.
The Option will terminate on the expiration date set forth in the Award Notice (the “Expiration Date”) except as otherwise provided in Section 2 or if exercised pursuant to Section 3. Upon the termination of the Option, the Option will no longer be exercisable and will immediately become null and void.
2. Time and Manner of Exercise of Option.
(a) Maximum Term of Option. Except as specifically provided in Section 2(b) below, the Option may not be exercised, in whole or in part, after the Expiration Date.
(b)Vesting and Exercise of Option. The Option will vest and become exercisable in accordance with the vesting schedule specified in the Award Notice (the “Vesting Schedule”), subject to Section 3 below. If Optionee’s employment terminates before the Option is fully vested, the Option will vest and be exercisable as follows:
|
|
(i) |
Notwithstanding the provisions of Section 5 below, in the event of Optionee’s death while the Award is outstanding, the Option will immediately become fully exercisable (to the extent not exercisable on the date of death) and will continue to be exercisable by Optionee’s beneficiary, executor, administrator or legal representative through the earlier of: (A) the date which is three (3) years after the date of Optionee’s death, and (B) the Expiration Date; provided, however, that the Option will continue to be exercisable for at least one (1) year following the date of Optionee’s death, even if this one-year period extends beyond the Expiration Date. |
1
|
|
(iii) |
Notwithstanding the provisions of Section 5 below, in the event of Optionee’s Retirement (as defined below) while the Award is outstanding, any unvested Options will fully vest and become exercisable as of date of Optionee’s Retirement and will remain exercisable through the Expiration Date, subject to Section 3 below and provided that Optionee has been continuously employed with the Company for at least one (1) year following the Award Date. For purposes of this Award, “Retirement” means Optionee’s termination of employment (other than for Cause as described in subsection (iv) below) on or after attaining age 55 and completing five (5) years of service with the Company or its predecessors or affiliates. In the event of a Change in Control (as defined in Section 5 below), Optionee will receive the treatment described in this Section 2(b)(iii) if Optionee terminates employment after qualifying for Retirement, even if Optionee does not have Good Reason (as defined below). |
|
|
(iv) |
If the Optionee’s employment is terminated for Cause (as defined below) while the Award is outstanding, then all options (including without limitation any vested but unexercised Options) will be forfeited and cancelled immediately upon such termination. For purposes of this Award, “Cause” has the same meaning as specified in any employment or other written agreement between Optionee and Optionee’s employer regarding benefits upon termination of employment (“Termination Agreement”), provided that if Optionee is not a party to a Termination Agreement that contains such definition, then Cause shall mean termination of employment for: (A) dishonesty or fraud; (B) commission of any act, or omission to act, that causes or may cause damage or detriment to the business, employees, property or reputation of the Company or its Subsidiaries; (C) dereliction of duty; (D) gross misconduct, gross negligence or gross malfeasance; or (E) violation of the code of conduct and/or personnel policies of the Company or its Subsidiaries. |
2
|
|
cancelled as of Optionee’s termination date and vested Options will remain exercisable through the earlier of: (A) three (3) months following Optionee’s termination, or (B) the Expiration Date. Any vested Options not exercised within three (3) months of the Optionee’s termination will be forfeited and cancelled by the Company. |
|
|
(vi) |
For the purposes of this Agreement, (i) a transfer of Optionee’s employment from the Company to a Subsidiary or vice versa, or from one Subsidiary to another, without an intervening period, will not be deemed a termination of employment; and (ii) if Optionee is granted in writing a leave of absence, Optionee will be deemed to have remained in the employ of the Company or a Subsidiary during such leave of absence. |
3. Method of Exercise. Subject to this Agreement, the Option may be exercised as follows:
(a) By specifying the number of whole shares of Common Stock to be purchased in the manner prescribed by the Company, accompanied by full payment (or by arranging for full payment to the Company’s satisfaction) either:
|
|
(i) |
in cash; |
|
|
(ii) |
by delivery to the Company (either actual delivery or by attestation procedures established by the Company) of shares of Common Stock having an aggregate “Fair Market Value” (as defined below), determined as of the date of exercise, equal to the aggregate purchase price payable pursuant to the Option; |
|
|
(iii) |
by authorizing the Company to sell shares of Common Stock subject to the option exercise and withhold from the proceeds an amount equal to the option exercise price; or |
|
|
(iv) |
by a combination of (i), (ii) and (iii); and |
(b) By executing such documents as the Company may reasonably request.
For this purpose, “Fair Market Value” as of any date means the value determined by reference to the closing price of a share of Common Stock as finally reported on the New York Stock Exchange for the trading day immediately preceding such date. Any fraction of a share of Common Stock which would be required to pay such purchase price will be disregarded and the remaining amount due will be paid in cash by Optionee. No Common Stock will be issued or delivered until the full purchase price and any related withholding taxes, as described in Section 10 herein, have been paid.
4. Issuance or Delivery of Shares. Upon the exercise of the Option, in whole or in part, the Company will issue or deliver, subject to the conditions of this Agreement, the number of shares of Common Stock purchased. Such issuance will be evidenced by the appropriate entry on the books of the Company or of a duly authorized transfer agent of the Company. The Company will pay all original issue or transfer taxes and all fees and expenses related to such issuance, except
3
as otherwise provided in Section 10 herein.
5. Change in Control. In the event of a Change in Control, the Award will become subject to Section 5.8 of the Plan. In the event that Options remain outstanding following a Change in Control and Optionee’s employment is terminated either: (i) by the Company other than for Cause (as defined in Paragraph 2(b)(iv) above), or (ii) by Optionee for Good Reason (as defined below), in each case, on or within two years after such Change in Control but while the Options are outstanding, the Options will become fully vested, exercisable and nonforfeitable as of the date of such termination of employment and will remain exercisable through the Expiration Date, subject to Section 5.8 of the Plan. For purposes of this Award, “Good Reason” will have the same meaning as such term has under any Termination Agreement, provided that if Optionee is not a party to any Termination Agreement that contains such definition, then Good Reason shall mean the Optionee’s termination of the Optionee’s employment for any of the following reasons without the Optionee’s consent: (A) a material diminution in the Optionee’s duties, responsibilities and status as in effect immediately preceding the Change in Control; (B) a material reduction in the Optionee’s base salary as in effect immediately preceding the Change in Control; or (C) requiring Optionee to relocate to an office more than 50 miles from the offices at which the Optionee was based immediately preceding the Change in Control, except for required travel on Company business to an extent substantially consistent with Optionee’s position; provided, however, that in order to terminate Holder’s employment for Good Reason, Holder must (x) provide written notice of his or her intent to terminate employment within 30 days following the initial existence of the event or circumstance giving rise to Good Reason, (y) the Company must be provided an opportunity to cure the event or circumstance giving rise to “Good Reason for a period of 30 days; and (z) if not cured, the Holder must terminate his or her employment due to Good Reason within 30 days following the expiration of the Company’s cure period.
6.No Stockholder Rights. Optionee will not have any rights of a stockholder (including voting rights) or any other right, title or interest, with respect to any of the shares of Common Stock subject to the Option unless and until such shares of Common Stock have been recorded on the Company’s official stockholder records as having been issued or transferred to Optionee.
7.Compliance with Applicable Law. The Award is subject to the condition that if the listing, registration or qualification of the shares subject to the Award upon any securities exchange or under any law, or the consent or approval of any governmental body, or the taking of any other action is necessary or desirable as a condition of, or in connection with, the vesting of the Options or the delivery or issuance of shares, the shares of Common Stock subject to the Award may not be delivered, in whole or in part, unless such listing, registration, qualification, consent, approval or other action has been effected or obtained, free of any conditions not acceptable to the Company. The Company agrees to use reasonable efforts to obtain and maintain any such listing, registration, qualification, consent, approval or other action.
8.Clawback Policy. Notwithstanding any provision of the Plan or this Agreement to the contrary, outstanding Options may be cancelled, and the Company may require Optionee to return shares of Common Stock (or the value of such stock when originally issued to Optionee) issued under this Agreement and any other amount required by applicable law to be returned, in the
4
event that such repayment is required in order to comply with any laws or regulations relating to restatements of the Company’s publicly-reported financial results.
9.Nontransferability. The Award may not be transferred, assigned, pledged or hypothecated in any manner, by operation of law or otherwise by Optionee other than (a) by will or by the laws of descent and distribution; or (b) pursuant to an approved domestic relations order approved in writing by the Secretary of the Committee or the Secretary’s designee. Except to the extent permitted by the foregoing sentence, the Award may not be sold, transferred, assigned, pledged, hypothecated, encumbered or otherwise disposed of (whether by operation of law or otherwise) or be subject to execution, attachment or similar process. Upon any attempt to so sell, transfer, assign, pledge, hypothecate, encumber or otherwise dispose of the Award, the Award and all related rights will immediately become null and void.
10. Tax Withholding. As a condition to the delivery of shares of Common Stock upon the exercise of Options, Optionee must, upon request by the Company, pay to the Company such amount as the Company may be required, under all applicable federal, state, local or other laws or regulations, to withhold and pay over as income or other withholding taxes (the “Required Tax Payments”) with respect to the Award. If Optionee fails to advance the Required Tax Payments after request by the Company, the Company may, in its discretion, deduct any Required Tax Payments from any amount payable by the Company to Optionee, including regular salary or bonus payments. No shares of Common Stock will be issued or delivered until the Required Tax Payments have been paid in full. Optionee may elect to satisfy his or her obligation to advance the Required Tax Payments by any of the following means: (a) a cash payment to the Company; (b) delivery to the Company (either actual delivery or by attestation procedures established by the Company) of previously owned whole shares of Common Stock having an aggregate Fair Market Value (as defined in Section 3), determined as of the date on which such withholding obligation arises (the “Tax Date”), equal to the Required Tax Payments; (c) authorizing the Company to withhold whole shares of Common Stock which would otherwise be delivered to Optionee having an aggregate Fair Market Value, determined as of the Tax Date, equal to the Required Tax Payments; or (d) any combination of (a), (b) and (c). Shares of Common Stock may not have an aggregate Fair Market Value in excess of the amount determined by applying the maximum statutory withholding rate in the applicable jurisdiction. The number of shares to be delivered to the Company or withheld from the Holder shall be determined by applying the maximum statutory withholding rate, if the Holder makes such an election. Any fraction of a share of Common Stock which would be required to satisfy any Required Tax Payment will be disregarded and the remaining amount due must be paid in cash by Optionee. No share of Common Stock will be issued or delivered until the Required Tax Payments have been satisfied in full.
11.Adjustment. In the event of any stock split, stock dividend, recapitalization, reorganization, merger, consolidation, combination, exchange of shares, liquidation, spin-off or other similar change in capitalization or event, or any distribution to optionees of Common Stock other than a regular cash dividend, the number and class of securities subject to the Option will be equitably adjusted by the Committee, such adjustment to be made in accordance with Section 409A of the Code, to the extent applicable. The decision of the Committee regarding any such adjustment is final and binding.
12.No Rights to Continued Employment. In no event will the granting of the Option or its acceptance by Optionee, or any provision of this Agreement or the Plan, give or be deemed to
5
give Optionee any right to continued employment by the Company, any Subsidiary or any affiliate of the Company or affect in any manner the right of the Company, any Subsidiary or any affiliate of the Company to terminate the employment of any person at any time for any reason.
13.Restrictive Covenants. In exchange for accepting the Award and in consideration of the Confidential Information (defined below) the Company provides to Optionee, benefits Optionee is not otherwise entitled to, Optionee agrees to the following restrictive covenants:
(a)Confidential Information. Optionee acknowledges that he/she has access to highly confidential information of the Company and any Subsidiary that Optionee provides services to or is provided confidential information about, including but not limited to, information concerning: finances, supply and service, marketing, customers (including lists), operations, business and financial plans and strategies, and product costs, sourcing and pricing (“Confidential Information”). The Optionee agrees that during his/her employment and for three years following the end of Optionee’s employment (for whatever reason), Optionee will protect the Confidential Information and only use it for business-related reasons; however, trade secrets will always remain protected for as long as the information qualifies as a trade secret under applicable law. The obligations of this Agreement (including, but not limited to the confidentiality obligations) do not prohibit Optionee from reporting any event that Optionee reasonably and in good faith believes is a violation of law to the relevant law-enforcement agency (such as the Securities and Exchange Commission, Equal Employment Opportunity Commission, or Department of Labor), cooperating in an investigation conducted by such a government agency, or disclosing to such a government agency any Confidential Information that is lawfully acquired by Optionee and that Optionee reasonably and in good faith believes is relevant to the matter at issue. Similarly, pursuant to the Defend Trade Secrets Act of 2016, Employee shall not be held criminally or civilly liable under any Federal or State trade secret law for disclosing a trade secret if that disclosure is (A) made in confidence to an attorney or a Federal, State, or local government official, either directly or indirectly, and is solely for the purpose of reporting or investigating a suspected violation of law; or (B) is made in a complaint or other document filed under seal in a lawsuit or other proceeding. Further, an individual who files a lawsuit for retaliation by an employer for reporting a suspected violation of law may disclose the trade secret to the individual’s attorney and may use the trade secret information in the court proceeding, provided the individual (1) files any document containing the trade secret under seal; and (2) does not disclose the trade secret, except pursuant to court order.
(b)Non-Competition. Optionee agrees that he/she will not, directly or indirectly, for a period of 12 months after the end of Optionee’s employment (for whatever reason), engage in a Prohibited Capacity within the Restricted Area on behalf of a business that manufactures, distributes, offers, sells or provides any Competing Products. “Competing Products” means any products and/or services that are similar in function or purpose to those offered by the Company and its Subsidiaries and as to which Optionee had Involvement. “Involvement” means to have responsibilities, provide supervision, engage in dealings or receive Confidential Information about during the last two (2) years immediately preceding the end of Optionee’s employment (the “Look Back Period”). "Prohibited Capacity" means to engage in the same or similar capacity or function that Optionee worked for the Company and/or its Subsidiaries at any time during the Look Back Period or in a capacity that would otherwise result in the use or disclosure of Confidential Information. “Restricted Area”
6
means those geographic areas in which the Company and its Subsidiaries do business and as to which business Optionee had Involvement.
(c)Non-Solicitation of Customers. Optionee agrees that he/she will not, directly or indirectly, during his/her employment and for a period of 12 months after the end of his/her employment (for whatever reason), solicit, induce or attempt to induce (or assist others to solicit) any customers or prospective customers of the Company and its Subsidiaries to cease doing business with the Company and its Subsidiaries or to buy a Competing Product. The prohibition in this Section 13(c) only applies to customers and prospective customers with which Optionee had Involvement.
(d)Non-Solicitations of Employees. Optionee agrees that he/she will not, directly or indirectly, for a period of 12 months after the end of his/her employment (for whatever reason), solicit (or assist another in soliciting), induce, employ or seek to employ any individual employed by Company and/or its Subsidiaries. Where an additional restriction is required to enforce the foregoing, Optionee’s non-solicitation obligation is limited to employees with whom Optionee had Involvement.
(e)Reasonableness of Restrictions. Optionee acknowledges that the temporal, activity and geographic limitations of Sections 13(a), (b), (c) and (d) above are reasonable in scope and narrowly constructed so as to protect only the Company and its Subsidiaries’ legitimate protectable interests, and will not prohibit Optionee from obtaining meaningful employment following the end of Optionee’s employment.
(f)Tolling of Restrictive Period. The periods described in Sections 13(a), (b), (c) and (d) above shall not run during any period of time in which the Optionee is in violation of this paragraph, and shall toll during any such period of violation. If Optionee resides in and is subject to the laws of Wisconsin, then this paragraph shall not apply.
(g)General. (i) Before accepting new employment, Optionee will advise any such future employer of the restrictions in this Agreement. Optionee agrees that the Company and its Subsidiaries may advise any such future employer or prospective employer of this Agreement and their position on the potential application of this Agreement without such giving rise to any legal claim. (ii) The obligations in this Agreement shall survive the termination of Optionee’s employment and shall, likewise, continue to apply and be valid notwithstanding any change in Optionee’s employment terms (such as, without limitation, a change in duties, responsibilities, compensation, position or title). (iii) The Subsidiaries are third party beneficiaries of the Agreement and may enforce the Agreement without the need for further consent or agreement by the Optionee. (iv) If either party waives his, her, or its right to pursue a claim for the other’s breach of any provision of the Agreement, the waiver will not extinguish that party’s right to pursue a claim for a subsequent breach. (v) This Agreement shall not be construed to supersede or replace any prior agreements containing confidentiality, nondisclosure, non-competition and non-solicitation provisions. Rather, the restrictions in this Agreement shall be read together with such prior agreements to afford the Company and its Subsidiaries the broadest protections allowed by law. (vi) If a court finds any of the Agreement’s restrictions unenforceable as written, the parties agree the court is authorized and expected under the terms of this Agreement to revise the restriction (for the jurisdiction covered by that court only) so as to make it enforceable, or if such revision is not
7
permitted then to enforce the otherwise unreasonable or unenforceable restriction to such lesser extent as would be deemed reasonable and lawful within that jurisdiction. (vii) If Holder resides in California: Sections 13(b) and (d) shall not apply; Section 13(c) shall only apply if Holder uses or discloses the Company’s or its Subsidiaries’ trade secrets per Cal. Bus. & Prof. Code §16600; and Section 18 shall not apply.
14.Decisions of Board or Committee. The Board or the Committee has the right to resolve all questions which may arise in connection with the Option. Any interpretation, determination or other action made or taken by the Board or the Committee regarding the Plan or this Agreement is final and binding.
15.Successors. This Agreement is binding upon and will inure to the benefit of any successor or successors of the Company and any person or persons who, upon the death of Optionee, may acquire any rights in accordance with this Agreement or the Plan.
16.Notices. All notices, requests or other communications provided for in this Agreement will be made, if to the Company, to Fortune Brands Home & Security, Inc., Attn. General Counsel, 520 Lake Cook Road, Deerfield, Illinois 60015, and if to Optionee, to the last known mailing address of Optionee contained in the records of the Company. All notices, requests or other communications provided for in this Agreement will be made in writing either (a) by personal delivery; (b) by facsimile or electronic mail with confirmation of receipt; (c) by mailing in the United States mails; or (d) by express courier service. The notice, request or other communication will be deemed to be received upon personal delivery, upon confirmation of receipt of facsimile or electronic mail transmission or upon receipt by the intended party if by United States mail or express courier service; provided, however, that if a notice, request or other communication sent to the Company is not received during regular business hours, it will be deemed to be received on the next succeeding business day of the Company.
17.Partial Invalidity. The invalidity or unenforceability of any particular provision of this Agreement will not affect any other provisions of this Agreement and this Agreement will be construed in all respects as if such invalid or unenforceable provisions were omitted.
18.Governing Law. This Agreement, the Award and all determinations made and actions taken with respect to this Agreement or Award, to the extent not governed by the Code or the laws of the United States, will be governed by, and construed in accordance with, the laws of the State of Delaware without giving effect to principles of conflicts of laws.
19.Agreement Subject to the Plan. This Agreement is subject to, and will be interpreted in accordance with, the Plan. In the event of a conflict between this Agreement and the Plan, the terms of the Plan will apply. Optionee hereby acknowledges receipt of a copy of the Plan, and by accepting the Award in the manner specified by the Company, he or she agrees to be bound by the terms and conditions of this Agreement, the Award, the Plan, and if applicable to the Optionee, stock ownership guidelines established by the Company.
21.Counterparts. This Agreement may be executed in one or more counterparts, all of which together will constitute but one Agreement.
8
Exhibit 10.14
FORTUNE BRANDS HOME & SECURITY, INC.
2013 LONG-TERM INCENTIVE PLAN
Form of [GRANT DATE] Performance Share Award Agreement (the “Agreement”)
[VESTING SCHEDULE]
Fortune Brands Home & Security, Inc., a Delaware corporation (the “Company”), grants to the undersigned “Holder” a performance stock award subject to the terms and conditions of the Fortune Brands Home & Security, Inc. 2013 Long-Term Incentive Plan (the “Plan”) and this Agreement (collectively, the “Award”). The date of the grant, the number of shares of Common Stock of the Company to be paid to Holder under the Award (“Performance Shares”), the minimum, target and maximum goals (“Performance Measures”) and the period during which the Performance Measures may be achieved (the “Performance Period”), are provided in a separate notice outlining specifics of the Award (the “Award Notice”) and on the Plan’s online administrative system. Capitalized terms not defined in this Agreement have the meanings specified in the Plan.
1.Number of Shares Payable Pursuant to Award. Subject to the certification by the Committee and except as otherwise provided in this Agreement, the number of Performance Shares payable to Holder shall be determined based on the satisfaction of the Performance Measures as set forth in the Award Notice; provided, however, that no Performance Shares shall be payable for the Performance Period if the actual achievement of the Performance Measures is less than the minimum Performance Measures established for the Performance Period. Any Performance Shares that become payable to Holder under this Award will be issued to Holder (or, in the event of Holder’s death or termination due to Disability, Holder’s appointed and qualified executor or other personal representative) by the Company as soon as practicable following: (i) the end of the Performance Period; and (ii) the certification by the Committee of the Company’s achievement of the Performance Measures (but in any event no later than sixty (60) days following the end of the Performance Period). In addition, no fractional shares will be delivered.
2.Termination of Employment During the Performance Period.
(a)In the event of Holder’s death during the Performance Period, Holder’s beneficiary or estate (as applicable) will be entitled to receive, as soon as practicable following the certification of performance by the Committee following the end of the Performance Period (as described in Section 1 above), a payment of the number of shares of Company Common Stock, if any, that would have otherwise been payable to Holder had Holder’s death not occurred prior to the end of the Performance Period, based upon actual performance during the entire Performance Period.
(b)In the event of Holder’s Retirement or termination due to Disability (each as defined below) during the Performance Period but after the one-year anniversary of the Grant Date (as specified in the Award Notice), Holder will be entitled to receive, as soon as practicable following the certification of the Company’s performance by the Committee following the end
of the Performance Period (as described in Section 1 above), a payment of the number of shares of Company Common Stock, if any, that would have otherwise been payable to Holder had Holder’s employment not terminated prior to the end of the Performance Period, based upon actual performance during the entire Performance Period. Notwithstanding the foregoing, in the event of a Change in Control (as described in Section 4 below), Holder will receive the number of shares determined under Section 4 of this Agreement, as applicable, and not this Section 2, even if Holder is eligible for Retirement when Holder’s employment terminates, and payment will be made at the time specified in Section 4. For purposes of this Award, (i) “Retirement” means Holder’s termination of employment (other than for Cause as described below) on or after attaining age 55 and completing five (5) years of service with the Company or its predecessors or affiliates; and (ii) Holder will have a “Disability” if Holder is receiving benefits under the long-term disability plan maintained by Holder’s employer at the time of Holder’s termination of employment.
(c)If the Holder’s employer terminates Holder’s employment for Cause (as defined below) at any time prior to the certification by the Committee of the Company’s achievement of the Performance Measures, then the Award will be forfeited and cancelled immediately upon such termination of employment. For purposes of this Award, “Cause” has the same meaning as specified in any employment or other written agreement between Holder and Holder’s employer regarding benefits upon termination of employment (“Termination Agreement”), provided that if Holder is not a party to a Termination Agreement that contains such definition, then Cause shall mean termination of employment for: (A) dishonesty or fraud; (B) commission of any act, or omission to act, that causes or may cause damage or detriment to the business, employees, property or reputation of the Company or its Subsidiaries; (C) dereliction of duty; (D) gross misconduct, gross negligence or gross malfeasance; or (E) violation of the code of conduct and/or personnel policies of the Company or its Subsidiaries.
(d)Except as otherwise provided in Section 4 below, if Holder’s employment terminates during the Performance Period for any reason other than death, Disability, or Retirement, the Award will be canceled as of Holder’s termination date and Holder will not be entitled to any payment of Performance Shares.
(e)For the purposes of this Agreement, (i) a transfer of Holder’s employment from the Company to a Subsidiary or vice versa, or from one Subsidiary to another, without an intervening period, will not be deemed a termination of employment; and (ii) if Holder is granted in writing a leave of absence, Holder will be deemed to have remained in the employ of the Company or a Subsidiary during such leave of absence (but not beyond Holder’s separation from service within the meaning of Section 409A of the Code if this Award is deemed to be subject to said Section, using a 29-month period rather than 6-months per U.S. Treasury Regulation §1.409A-1(h)(1)(i) for a leave of absence due to any medically determinable physical or mental impairment as contemplated under such section)..
3.Dividend Equivalents. Holder will be entitled to receive dividend equivalents with respect to the Award to the extent that the Company pays dividends on Company Common Stock during the Performance Period. Such dividend equivalents will be equal to the cash
2
dividends (if any) that would have been paid to Holder for the shares of Common Stock subject to the Award had such shares been issued and outstanding on the dividend record date occurring during the Performance Period. Dividend equivalents (if any) will be subject to the same vesting conditions as the Performance Shares and will be paid to Holder in cash at the same time as the shares of Common Stock subject to the Award are delivered.
4. Termination without Cause or for Good Reason Following Change in Control. In the event of a Change in Control, the Award will become subject to Section 5.8 of the Plan. In the event that the Performance Shares remain outstanding following a Change in Control and Holder’s employment is terminated following a Change in Control but prior to the end of the Performance Period either: (i) by the Company other than for Cause, or (ii) by Holder for “Good Reason” (as defined below), the Award will become nonforfeitable and will be paid to the Holder, subject to Section 19 of this Agreement, within sixty (60) days following the date Holder’s employment terminates assuming that the target Performance Measures under the Award for the entire Performance Period had been achieved; provided, however, if the Award is considered “nonqualified deferred compensation” (within the meaning of Section 409A of the Code) and (x) the Change in Control was not a “change in control event” within the meaning of Section 409A of the Code or (y) the termination of employment occurred more than two years following the occurrence of such “change in control event,” then the Award shall be paid to the Holder at the time specified in Section 1 of the Agreement. For purposes of this Award, “Good Reason” will have the same meaning as such term has under any Termination Agreement, provided that if Holder is not a party to any Termination Agreement that contains such definition, then Good Reason shall mean the Holder’s termination of the Holder’s employment for any of the following reasons without the Holder’s consent: (A) a material diminution in the Holder’s duties, responsibilities and status as in effect immediately preceding the Change in Control; (B) a material reduction in the Holder’s base salary as in effect immediately preceding the Change in Control; or (C) requiring Holder to relocate to an office more than 50 miles from the offices at which the Holder was based immediately preceding the Change in Control, except for required travel on Company business to an extent substantially consistent with Holder’s position; provided, however, that in order to terminate Holder’s employment for Good Reason, Holder must (x) provide written notice of his or her intent to terminate employment within 30 days following the initial existence of the event or circumstance giving rise to Good Reason, (y) the Company must be provided an opportunity to cure the event or circumstance giving rise to “Good Reason for a period of 30 days; and (z) if not cured, the Holder must terminate his or her employment due to Good Reason within 30 days following the expiration of the Company’s cure period..
5.No Stockholder Rights. Holder will not have any rights of a stockholder (including voting rights) or any other right, title or interest, with respect to any of the Performance Shares unless and until such shares have been recorded on the Company’s official stockholder records as having been issued or transferred to Holder in the form of Common Stock of the Company.
6.Compliance with Applicable Law. The Award is subject to the condition that if the listing, registration or qualification of the shares subject to the Award upon any securities exchange or under any law, or the consent or approval of any governmental body, or the taking of any other action is necessary or desirable as a condition of, or in connection with, the payment,
3
delivery or issuance of Performance Shares, the shares of Common Stock subject to the Award may not be delivered, in whole or in part, unless such listing, registration, qualification, consent, approval or other action has been effected or obtained, free of any conditions not acceptable to the Company. The Company agrees to use reasonable efforts to obtain and maintain any such listing, registration, qualification, consent, approval or other action.
7.Clawback Policy. Notwithstanding any provision of the Plan or this Agreement to the contrary, outstanding Performance Shares may be cancelled, and the Company may require Holder to return shares of Common Stock (or the value of such stock when originally paid to Holder), dividend equivalents (if any) issued under this Award and any other amount required by applicable law to be returned, in the event that such repayment is required in order to comply with the Company’s clawback policy or any laws or regulations relating to restatements of the Company’s publicly-reported financial results.
8.Nontransferability. This Award may not be transferred, assigned, pledged or hypothecated in any manner, by operation of law or otherwise by Holder, other than (a) by will or by the laws of descent and distribution; or (b) pursuant to an approved domestic relations order approved in writing by the Secretary of the Committee or the Secretary’s designee. Except to the extent permitted by the foregoing sentence, the Award may not be sold, transferred, assigned, pledged, hypothecated, encumbered or otherwise disposed of (whether by operation of law or otherwise) or be subject to execution, attachment or similar process. Upon any attempt to so sell, transfer, assign, pledge, hypothecate, encumber or otherwise dispose of the Award, the Award and all related rights will immediately become null and void.
9.Tax Withholding. As a condition to the delivery of shares of Common Stock, Holder must, upon request by the Company, pay to the Company such amount as the Company may be required, under all applicable federal, state, local or other laws or regulations, to withhold and pay over as income or other withholding taxes (the “Required Tax Payments”) with respect to the Award. If Holder fails to advance the Required Tax Payments after request by the Company, the Company may, in its discretion, deduct any Required Tax Payments from any amount payable by the Company to Holder, including regular salary or bonus payments. Holder may elect to satisfy his or her obligation to advance the Required Tax Payments by any of the following means: (a) a cash payment to the Company; (b) delivery to the Company (either actual delivery or by attestation procedures established by the Company) of previously owned whole shares of Common Stock having an aggregate Fair Market Value (as defined below), determined as of the date on which such withholding obligation arises (the “Tax Date”), equal to the Required Tax Payments; (c) authorizing the Company to withhold whole shares of Common Stock which would otherwise be delivered to Holder having an aggregate Fair Market Value, determined as of the Tax Date, equal to the Required Tax Payments; or (d) any combination of (a), (b) and (c). Shares of Common Stock may not have an aggregate Fair Market Value in excess of the amount determined by applying the maximum statutory withholding rate in the applicable jurisdiction. The number of shares to be delivered to the Company or withheld from the Holder shall be determined by applying the maximum statutory withholding rate, if the Holder makes such an election. For purposes of this Award, “Fair Market Value” as of any date means the value determined by reference to the closing price of a share of Common Stock as finally reported on the New York Stock Exchange for the trading day immediately preceding such date. Any fraction of a share of Common Stock which would be required to satisfy any Required Tax Payment will be disregarded and the remaining amount due must be paid in cash by Holder. No
4
share of Common Stock will be issued or delivered until the Required Tax Payments have been satisfied in full.
10.Adjustments.
(a) In the event of any stock split, stock dividend, recapitalization, reorganization, merger, consolidation, combination, exchange of shares, liquidation, spin-off or other similar change in capitalization or event, or any distribution to holders of Common Stock other than a regular cash dividend, the number and class of securities subject to the Award will be equitably adjusted by the Committee, such adjustment to be made in accordance with Section 409A of the Code, to the extent applicable. The decision of the Committee regarding any such adjustment is final and binding.
(b) Subject to Section 162(m) of the Code, appropriate and equitable adjustments (which may be increases or decreases) will be made by the Committee to the Performance Measures to take into account changes in law or to reflect the inclusion or exclusion of the impact of extraordinary or unusual items, events or circumstances, including, but not limited to (i) changes in laws, regulations and accounting principles; (ii) actuarial gains or losses related to defined benefit plan accounting; and (iii) impairment and restructuring related changes.
11.No Rights to Continued Employment. In no event will the granting of the Award or its acceptance by Holder, or any provision of this Agreement or the Plan, give or be deemed to give Holder any right to continued employment by the Company, any Subsidiary or any affiliate of the Company or affect in any manner the right of the Company, any Subsidiary or any affiliate of the Company to terminate the employment of any person at any time for any reason.
12.Restrictive Covenants. In exchange for accepting the Award and in consideration of the Confidential Information (defined below) the Company provides to Holder, benefits Holder is not otherwise entitled to, Holder agrees to the following restrictive covenants:
(a)Confidential Information. Holder acknowledges that he/she has access to highly confidential information of the Company and any Subsidiary that Holder provides services to or is provided confidential information about, including but not limited to, information concerning: finances, supply and service, marketing, customers (including lists), operations, business and financial plans and strategies, and product costs, sourcing and pricing (“Confidential Information”). The Holder agrees that during his/her employment and for three years following the end of Holder’s employment (for whatever reason), Holder will protect the Confidential Information and only use it for business-related reasons; however, trade secrets will always remain protected for as long as the information qualifies as a trade secret under applicable law. Nothing in this Agreement is intended to prohibit any activity by Holder which is protected by law. The obligations of this Agreement (including, but not limited to the confidentiality obligations) do not prohibit Holder from reporting any event that Holder reasonably and in good faith believes is a violation of law to the relevant law-enforcement agency (such as the Securities and Exchange Commission, Equal Employment Opportunity Commission, or Department of Labor), cooperating in an investigation conducted by such a government agency, or disclosing to such a government agency any Confidential Information
5
that is lawfully acquired by Holder and that Holder reasonably and in good faith believes is relevant to the matter at issue. Similarly, pursuant to the Defend Trade Secrets Act of 2016, Employee shall not be held criminally or civilly liable under any Federal or State trade secret law for disclosing a trade secret if that disclosure is (A) made in confidence to an attorney or a Federal, State, or local government official, either directly or indirectly, and is solely for the purpose of reporting or investigating a suspected violation of law; or (B) is made in a complaint or other document filed under seal in a lawsuit or other proceeding. Further, an individual who files a lawsuit for retaliation by an employer for reporting a suspected violation of law may disclose the trade secret to the individual’s attorney and may use the trade secret information in the court proceeding, provided the individual (1) files any document containing the trade secret under seal; and (2) does not disclose the trade secret, except pursuant to court order.
(b)Non-Competition. Holder agrees that he/she will not, directly or indirectly, for a period of 12 months after the end of Holder’s employment (for whatever reason), engage in a Prohibited Capacity within the Restricted Area on behalf of a business that manufactures, distributes, offers, sells or provides any Competing Products. “Competing Products” means any products and/or services that are similar in function or purpose to those offered by the Company and its Subsidiaries and as to which Holder had Involvement. “Involvement” means to have responsibilities, provide supervision, engage in dealings or receive Confidential Information about during the last two (2) years immediately preceding the end of Holder’s employment (the “Look Back Period”). "Prohibited Capacity" means to engage in the same or similar capacity or function that Holder worked for the Company and/or its Subsidiaries at any time during the Look Back Period or in a capacity that would otherwise result in the use or disclosure of Confidential Information. “Restricted Area” means those geographic areas in which the Company and its Subsidiaries do business and as to which business Holder had Involvement.
(c)Non-Solicitation of Customers. Holder agrees that he/she will not, directly or indirectly, during his/her employment and for a period of 12 months after the end of his/her employment (for whatever reason), solicit, induce or attempt to induce (or assist others to solicit) any customers or prospective customers of the Company and its Subsidiaries to cease doing business with the Company and its Subsidiaries or to buy a Competing Product. The prohibition in this Section 12(c) only applies to customers and prospective customers with which Holder had Involvement.
(d)Non-Solicitations of Employees. Holder agrees that he/she will not, directly or indirectly, for a period of 12 months after the end of his/her employment (for whatever reason), solicit (or assist another in soliciting), induce, employ or seek to employ any individual employed by Company and/or its Subsidiaries. Where an additional restriction is required to enforce the foregoing, Holder’s non-solicitation obligation is limited to employees with whom Holder had Involvement.
(e)Reasonableness of Restrictions. Holder acknowledges that the temporal, activity and geographic limitations of Sections 12(a), (b), (c) and (d) above are reasonable in scope and narrowly constructed so as to protect only the Company and its Subsidiaries’ legitimate protectable interests, and will not prohibit Holder from obtaining meaningful employment following the end of Holder’s employment.
6
(f)Tolling of Restrictive Period. The periods described in Sections 12(a), (b), (c) and (d) above shall not run during any period of time in which the Holder is in violation of this paragraph, and shall toll during any such period of violation. If Holder resides in and is subject to the laws of Wisconsin, then this paragraph shall not apply.
(g)General. (i) Before accepting new employment, Holder will advise any such future employer of the restrictions in this Agreement. Holder agrees that the Company and its Subsidiaries may advise any such future employer or prospective employer of this Agreement and their position on the potential application of this Agreement without such giving rise to any legal claim. (ii) The obligations in this Agreement shall survive the termination of Holder’s employment and shall, likewise, continue to apply and be valid notwithstanding any change in Holder’s employment terms (such as, without limitation, a change in duties, responsibilities, compensation, position or title). (iii) The Subsidiaries are third party beneficiaries of the Agreement and may enforce the Agreement without the need for further consent or agreement by the Holder. (iv) If either party waives his, her, or its right to pursue a claim for the other’s breach of any provision of the Agreement, the waiver will not extinguish that party’s right to pursue a claim for a subsequent breach. (v) This Agreement shall not be construed to supersede or replace any prior agreements containing confidentiality, nondisclosure, non-competition and non-solicitation provisions. Rather, the restrictions in this Agreement shall be read together with such prior agreements to afford the Company and its Subsidiaries the broadest protections allowed by law. (vi) If a court finds any of the Agreement’s restrictions unenforceable as written, the parties agree the court is authorized and expected under the terms of this Agreement to revise the restriction (for the jurisdiction covered by that court only) so as to make it enforceable, or if such revision is not permitted then to enforce the otherwise unreasonable or unenforceable restriction to such lesser extent as would be deemed reasonable and lawful within that jurisdiction. (vii) If Holder resides in California: Sections 13(b) and (d) shall not apply; Section 13(c) shall only apply if Holder uses or discloses the Company’s or its Subsidiaries’ trade secrets per Cal. Bus. & Prof. Code §16600; and Section 18 shall not apply.
13.Decisions of Board or Committee. The Board or the Committee has the right to resolve all questions which may arise in connection with the Award. Any interpretation, determination or other action made or taken by the Board or the Committee regarding the Plan or this Agreement is final and binding.
14.Successors. This Agreement is binding upon and will inure to the benefit of any successor or successors of the Company and any person or persons who, upon the death of Holder, may acquire any rights in accordance with this Agreement or the Plan.
15.Notices. All notices, requests or other communications provided for in this Agreement will be made, if to the Company, to Fortune Brands Home & Security, Inc., Attn. General Counsel, 520 Lake Cook Road, Deerfield, Illinois 60015, and if to Holder, to the last known mailing address of Holder contained in the records of the Company. All notices, requests or other communications provided for in this Agreement will be made in writing either (a) by personal delivery; (b) by facsimile or electronic mail with confirmation of receipt; (c) by mailing in the United States mails; or (d) by express courier service. The notice, request or other communication will be deemed to be received upon personal delivery, upon confirmation of receipt of facsimile or electronic mail transmission or upon receipt by the intended party if by United States mail or
7
express courier service; provided, however, that if a notice, request or other communication sent to the Company is not received during regular business hours, it will be deemed to be received on the next succeeding business day of the Company.
16.Partial Invalidity. The invalidity or unenforceability of any particular provision of this Agreement will not affect any other provisions of this Agreement and this Agreement will be construed in all respects as if such invalid or unenforceable provisions were omitted.
17.Governing Law. This Agreement, the Award and all determinations made and actions taken with respect to this Agreement or Award, to the extent not governed by the Code or the laws of the United States, will be governed by, and construed in accordance with, the laws of the State of Delaware without giving effect to principles of conflicts of laws.
18.Agreement Subject to the Plan. This Agreement is subject to, and will be interpreted in accordance with, the Plan. In the event of a conflict between this Agreement and the Plan, the terms of the Plan will apply. Holder hereby acknowledges receipt of a copy of the Plan, and by accepting the Award in the manner specified by the Company, he or she agrees to be bound by the terms and conditions of this Agreement, the Award, the Plan, and if applicable to the Holder, stock ownership guidelines established by the Company.
19.Section 409A. Any payment of Performance Shares to the Holder pursuant to this Agreement is intended to be exempt from Section 409A of the Code to the maximum extent possible as a short-term deferral pursuant to Treasury Regulation §1.409A-1(b)(4). However, if this Agreement and the Award are not so exempt, then this Agreement and Award are intended to comply with the requirements of Section 409A of the Code and will be interpreted and construed consistently with such intent. In the event the terms of this Agreement would subject Holder to taxes or penalties under Section 409A of the Code (“409A Penalties”), Holder and the Company will cooperate diligently to amend the terms of this Agreement to avoid such 409A Penalties, to the extent possible; provided that in no event will the Company be responsible for any 409A Penalties that arise in connection with any amounts payable under this Agreement. To the extent any amounts under this Agreement are payable by reference to Holder’s “termination of employment,” such term will be deemed to refer to Holder’s “separation from service,” within the meaning of Section 409A of the Code. Notwithstanding any other provision in this Agreement, if Holder is a “specified employee,” as defined in Section 409A of the Code, as of the date of Holder’s separation from service, then to the extent any amount payable to Holder (a) is payable upon Holder’s separation from service, and (b) under the terms of this Agreement would be payable prior to the six-month anniversary of Holder’s separation from service, to the extent that payment under this Agreement is otherwise subject to the provisions of Section 409A of the Code, such payment will be delayed until the earlier to occur of: (x) the six-month anniversary of Holder’s separation from service and (y) the date of Holder’s death. If any applicable payment period begins in one calendar year and ends in the following calendar year, Holder shall not have the right to designate the year of the payment.
20.Counterparts. This Agreement may be executed in one or more counterparts, all of which together will constitute but one Agreement.
8
Exhibit 10.15
Fortune Brands Home &Security, Inc.
2013 Long-Term Incentive Plan
Form of [GRANT DATE] Restricted Stock Unit Agreement (the “Agreement”)
Fortune Brands Home &Security, Inc., a Delaware corporation (the “Company”), grants to the undersigned “Holder” an award of restricted stock units (“RSUs”) subject to the terms and conditions of the Fortune Brands Home &Security, Inc. 2013 Long-Term Incentive Plan (the “Plan”), the Award Notice (“Award Notice”), and this Agreement (collectively, the “Award”). Capitalized terms not defined in this Agreement have the meanings specified in the Plan.
|
1. |
Number of RSUs. The date of the grant (the “Award Date”) and the number of RSUs granted to Holder under the Award are provided in the Award Notice and in the Plan’s online administrative system. Except as described below, this Award will become null and void unless Holder accepts this Agreement in a timely manner through the grant acceptance process prescribed by the Company. |
|
|
|
2. |
Restriction Period and Vesting |
|
(a) |
Subject to the terms and conditions of this Agreement and the Plan, the RSUs subject to the Award will vest in accordance with the vesting schedule described in the Award Notice (the “Restriction Period”), provided that the Holder remains continuously employed with the Company through each applicable vesting date. Notwithstanding the foregoing, if, because the New York Stock Exchange (or such successor exchange on which shares of Company Common Stock are traded) is not open for trading on such date, the vesting date will be the next date on which the New York Stock Exchange (or such successor exchange) is open for trading. |
|
|
(b) |
In the event of Holder’s death during the Restriction Period, the RSUs will fully vest on the date of such death and will become immediately eligible for distribution. |
|
|
(c) |
Notwithstanding the provisions of Section 5 below, in the event of Holder’s Retirement (as defined below) during the Restriction Period and after the one-year anniversary of the Award Date, any unvested RSUs will fully vest as of the date of Holder’s Retirement and all RSUs granted under this Award will become immediately eligible for distribution. For purposes of this Award, “Retirement” means Holder’s termination of employment (other than for Cause as described in subsection (e) below) on or after attaining age 55 and completing five (5) years of service with the Company or its predecessors or affiliates. In the event of a Change in Control (as defined in Section 5 below), Holder will receive the treatment described in this Section 2(c) if Holder terminates employment after qualifying for Retirement, even if Holder does not have Good Reason (as defined below). |
|
|
(d) |
In the event of Holder’s Disability (as defined below) during the Restriction Period and after the one (1) year anniversary of the Award Date, Holder will be treated as continuing employment with the Company during the Disability for purposes of determining the vesting of the Award, and RSUs will continue to vest and will be eligible for distribution in accordance with the vesting schedule described in Section 2(a) above. For purposes of this Award, Holder will have a “Disability” if Holder is approved for long-term disability benefits under the long-term disability plan maintained by Holder’s employer; provided that, if this Award is subject to the restrictions of Section 409A of the Code with respect to Holder, then such Disability must also satisfy the requirements of Section 22(e)(3) of the Code. |
|
|
contains such definition, then Cause shall mean termination of employment for: (A) dishonesty or fraud; (B) commission of any act, or omission to act, that causes or may cause damage or detriment to the business, employees, property or reputation of the Company or its Subsidiaries; (C) dereliction of duty; (D) gross misconduct, gross negligence or gross malfeasance; or (E) violation of the code of conduct and/or personnel policies of the Company or its Subsidiaries. |
|
|
(f) |
Except as provided in Section 5 below, if Holder’s employment with the Company terminates during the Restriction Period for any reason other than death, Disability or Retirement, the Award, to the extent not vested on the effective date of such termination of employment, will not vest and will be forfeited and cancelled as of Holder’s termination date. |
|
|
(g) |
Except as provided under Sections 2(b) and 2(c), if Holder is a “covered employee” for purposes of Section 162(m) (or any successor provision) of the Code at any time during the Restriction Period, any unvested RSUs will not vest unless and until the date on which the Committee certifies the attainment of the performance goals set forth in the Award Notice (which certification shall occur no later than 60 days following the end of the applicable performance period). |
|
|
(h) |
For the purposes of this Agreement, (i) a transfer of Holder's employment from the Company to a Subsidiary or vice versa, or from one Subsidiary to another, without an intervening period, will not be deemed a termination of employment; and (ii) if Holder is granted in writing a leave of absence, Holder will be deemed to have remained in the employ of the Company or a Subsidiary during such leave of absence (but not beyond Holder’s separation from service within the meaning of Section 409A of the Code if this Award is deemed to be subject to said Section, using a 29-month period rather than 6-months per U.S. Treasury Regulation §1.409A-1(h)(1)(i) for a leave of absence due to any medically determinable physical or mental impairment as contemplated under such section). |
|
|
(i) |
If Holder is eligible to participate in the Fortune Brands Home &Security, Inc. Deferred Compensation Plan (“NQDC Plan”) and makes a timely election to defer receipt of a portion of the RSUs granted under this Award, any such deferred RSUs will also be subject to the terms and conditions of the NQDC Plan and deferral election, which shall govern the timing of the distribution of the award, the payment of any related tax obligations and the treatment of the deferred RSUs following a Change in Control (as defined in the NQDC Plan). |
|
|
3. |
Delivery of Common Stock. During the Restriction Period, the RSUs will represent only an unfunded and unsecured obligation of the Company. Subject to Section 20 of this Agreement, within sixty (60) days following each applicable vesting date described in the Award Notice or any other applicable distribution date specified under this Agreement, unless Holder has elected to defer receipt of a portion of the RSUs under the NQDC Plan, the Company will deliver or cause to be delivered one share of Common Stock for each RSU that vests or becomes eligible for distribution on such date to Holder (or, in the event of Holder’s death or Disability, Holder’s appointed and qualified executor or other personal representative). No fractional shares will be delivered. Any RSUs deferred under the NQDC Plan that become vested, will continue to represent only an unfunded and unsecured obligation of the Company and will be distributed in accordance with the terms of the NQDC Plan and the applicable deferral election. |
|
|
4. |
Dividend Equivalents. Holder will be entitled to receive dividend equivalents with respect to the Award, to the extent that the Company pays dividends on Company Common Stock during the Restriction Period. Such dividend equivalents will be equal to the cash dividends (if any) that would have been paid to Holder for the shares of Common Stock subject to the Award had such shares been issued and outstanding on the dividend record date occurring during the Restriction Period. Dividend equivalents (if any) will be subject to the same vesting conditions as the RSUs and will be paid to Holder in cash at the same time as the shares of Common Stock subject to the Award are delivered in accordance with Section 3. In the event that the Holder has elected to defer receipt of a portion of the RSUs, dividend equivalents will be credited at the time of vesting to the Holder’s deferral account in accordance with the terms of the NQDC Plan. |
|
|
5. |
Termination without Cause or for Good Reason Following Change in Control. In the event of a Change in Control, the Award will become subject to Section 5.8 of the Plan. In the event that unvested RSUs remain outstanding following a Change in Control, and Holder’s employment is terminated on or after such Change in Control but prior to the end of the Restriction Period either: (i) by the Company other than for Cause, or (ii) by Holder for Good Reason (as defined below), the RSUs will become fully vested and immediately eligible for distribution as of the date of Holder’s termination of employment. For purposes of this Award, “Good Reason” will have the same meaning as such term has under any Termination Agreement, provided that if Holder is not a party to any Termination Agreement that contains such definition, then Good Reason shall mean the Holder’s termination of the Holder’s employment for any of the following reasons without the Holder’s consent: (A) a material diminution in the Holder’s duties, responsibilities and status as in effect immediately preceding the Change in Control; (B) a material reduction in the Holder’s base salary as in effect immediately preceding the Change in Control; or (C) requiring Holder to relocate to an office more than 50 miles from the offices at which the Holder was based immediately preceding the Change in Control, except for required travel on Company business to an extent substantially consistent with Holder’s position; provided, however, that in order to terminate Holder’s employment for Good Reason, Holder must (x) provide written notice of his or her intent to terminate employment within 30 days following the initial existence of the event or circumstance giving rise to Good Reason, (y) the Company must be provided an opportunity to cure the event or circumstance giving rise to “Good Reason for a period of 30 days; and (z) if not cured, the Holder must terminate his or her employment due to Good Reason within 30 days following the expiration of the Company’s cure period. |
|
|
6. |
No Stockholder Rights. Holder will not have any rights of a stockholder (including voting rights) or any other right, title or interest, with respect to any of the shares of Common Stock subject to the Award unless and until such shares of Common Stock have been recorded on the Company's official stockholder records as having been issued or transferred to Holder. |
|
|
7. |
Compliance with Applicable Law. The Award is subject to the condition that if the listing, registration or qualification of the shares subject to the Award upon any securities exchange or under any law, or the consent or approval of any governmental body, or the taking of any other action is necessary or desirable as a condition of, or in connection with, the vesting of the RSUs or the delivery or issuance of shares, the shares of Common Stock subject to the Award may not be delivered, in whole or in part, unless such listing, registration, qualification, consent, approval or other action has been effected or obtained, free of any conditions not acceptable to the Company. The Company agrees to use reasonable efforts to obtain and maintain any such listing, registration, qualification, consent, approval or other action. |
|
|
8. |
Clawback Policy. Notwithstanding any provision of the Plan or this Agreement to the contrary, outstanding RSUs may be cancelled, and the Company may require Holder to return shares of Company Common Stock (or the value of such stock when originally paid to Holder), dividend equivalents (if any) issued under this Agreement and any other amount required by applicable law to be returned, in the event that such repayment is required in order to comply with any laws or regulations relating to restatements of the Company’s publicly-reported financial results. |
|
|
9. |
Nontransferability. The Award may not be transferred, assigned, pledged or hypothecated in any manner, by operation of law or otherwise by Holder other than (a) by will or by the laws of descent and distribution; or (b) pursuant to an approved domestic relations order approved in writing by the Secretary of the Committee or the Secretary’s designee. Except to the extent permitted by the foregoing sentence, the Award may not be sold, transferred, assigned, pledged, hypothecated, encumbered or otherwise disposed of (whether by operation of law or otherwise) or be subject to execution, attachment or similar process. Upon any attempt to so sell, transfer, assign, pledge, hypothecate, encumber or otherwise dispose of the Award, the Award and all related rights will immediately become null and void. |
|
|
Company may, in its discretion, deduct any Required Tax Payments from any amount payable by the Company to Holder, including regular salary or bonus payments. Holder may elect to satisfy his or her obligation to advance the Required Tax Payments by any of the following means: (a) a cash payment to the Company; (b) delivery to the Company (either actual delivery or by attestation procedures established by the Company) of previously owned whole shares of Common Stock having an aggregate Fair Market Value (as defined below), determined as of the date on which such withholding obligation arises (the “Tax Date”), equal to the Required Tax Payments; (c) authorizing the Company to withhold whole shares of Common Stock which would otherwise be delivered to Holder having an aggregate Fair Market Value, determined as of the Tax Date, equal to the Required Tax Payments; or (d) any combination of (a), (b) and (c). Shares of Common Stock may not have an aggregate Fair Market Value in excess of the amount determined by applying the maximum statutory withholding rate in the applicable jurisdiction. The number of shares to be delivered to the Company or withheld from the Holder shall be determined by applying the maximum statutory withholding rate, if the Holder makes such an election. For purposes of this Award, “Fair Market Value” as of any date means the value determined by reference to the closing price of a share of Common Stock as finally reported on the New York Stock Exchange for the trading day immediately preceding such date. Any fraction of a share of Common Stock which would be required to satisfy any Required Tax Payment will be disregarded and the remaining amount due must be paid in cash by Holder. No share of Common Stock will be issued or delivered until the Required Tax Payments have been satisfied in full. In accordance with terms of the NQDC Plan, any tax obligations that arise upon vesting under this Agreement with respect to deferred RSUs credited to the NQDC shall not be deducted from the deferred RSUs and instead shall be deducted from any amount payable by the Company to the Holder, including the portion of this Award that has not been deferred into the NQDC Plan, subject in all instances to compliance with Section 409A of the Code. |
|
|
12. |
No Rights to Continued Employment. In no event will the granting of the Award or its acceptance by Holder, or any provision of this Agreement or the Plan, give or be deemed to give Holder any right to continued employment by the Company, any Subsidiary or any affiliate of the Company or affect in any manner the right of the Company, any Subsidiary or any affiliate of the Company to terminate the employment of any person at any time for any reason. |
|
13.Restrictive Covenants. In exchange for accepting the Award and in consideration of the Confidential Information (defined below) the Company provides to Holder, benefits Holder is not otherwise entitled to, Holder agrees to the following restrictive covenants:
|
if that disclosure is (A) made in confidence to an attorney or a Federal, State, or local government official, either directly or indirectly, and is solely for the purpose of reporting or investigating a suspected violation of law; or (B) is made in a complaint or other document filed under seal in a lawsuit or other proceeding. Further, an individual who files a lawsuit for retaliation by an employer for reporting a suspected violation of law may disclose the trade secret to the individual’s attorney and may use the trade secret information in the court proceeding, provided the individual (1) files any document containing the trade secret under seal; and (2) does not disclose the trade secret, except pursuant to court order. |
|
|
(b) |
Non-Competition. Holder agrees that he/she will not, directly or indirectly, for a period of 12 months after the end of Holder’s employment (for whatever reason), engage in a Prohibited Capacity within the Restricted Area on behalf of a business that manufactures, distributes, offers, sells or provides any Competing Products. “Competing Products” means any products and/or services that are similar in function or purpose to those offered by the Company and its Subsidiaries and as to which Holder had Involvement. “Involvement” means to have responsibilities, provide supervision, engage in dealings or receive Confidential Information about during the last two (2) years immediately preceding the end of Holder’s employment (the “Look Back Period”). "Prohibited Capacity" means to engage in the same or similar capacity or function that Holder worked for the Company and/or its Subsidiaries at any time during the Look Back Period or in a capacity that would otherwise result in the use or disclosure of Confidential Information. “Restricted Area” means those geographic areas in which the Company and its Subsidiaries do business and as to which business Holder had Involvement. |
|
|
(c) |
Non-Solicitation of Customers. Holder agrees that he/she will not, directly or indirectly, during his/her employment and for a period of 12 months after the end of his/her employment (for whatever reason), solicit, induce or attempt to induce (or assist others to solicit) any customers or prospective customers of the Company and its Subsidiaries to cease doing business with the Company and its Subsidiaries or to buy a Competing Product. The prohibition in this Section 13(c) only applies to customers and prospective customers with which Holder had Involvement. |
|
|
(d) |
Non-Solicitations of Employees. Holder agrees that he/she will not, directly or indirectly, for a period of 12 months after the end of his/her employment (for whatever reason), solicit (or assist another in soliciting), induce, employ or seek to employ any individual employed by Company and/or its Subsidiaries. Where an additional restriction is required to enforce the foregoing, Holder’s non-solicitation obligation is limited to employees with whom Holder had Involvement. |
|
|
(e) |
Reasonableness of Restrictions. Holder acknowledges that the temporal, activity and geographic limitations of Sections 13(a), (b), (c) and (d) above are reasonable in scope and narrowly constructed so as to protect only the Company and its Subsidiaries’ legitimate protectable interests, and will not prohibit Holder from obtaining meaningful employment following the end of Holder’s employment. |
|
|
(f) |
Tolling of Restrictive Period. The periods described in Sections 13(a), (b), (c) and (d) above shall not run during any period of time in which the Holder is in violation of this paragraph, and shall toll during any such period of violation. If Holder resides in and is subject to the laws of Wisconsin, then this paragraph shall not apply. |
|
(g) General. (i) Before accepting new employment, Holder will advise any such future employer of the restrictions in this Agreement. Holder agrees that the Company and its Subsidiaries may advise any such future employer or prospective employer of this Agreement and their position on the potential application of this Agreement without such giving rise to any legal claim. (ii) The obligations in this Agreement shall survive the termination of Holder’s employment and shall, likewise, continue to apply and be valid notwithstanding any change in Holder’s employment terms (such as, without limitation, a change in duties, responsibilities, compensation, position or title). (iii) The Subsidiaries are third party beneficiaries of the Agreement and may enforce the Agreement without the need for further consent or agreement by the Holder. (iv) If either party waives his, her, or
its right to pursue a claim for the other’s breach of any provision of the Agreement, the waiver will not extinguish that party’s right to pursue a claim for a subsequent breach. (v) This Agreement shall not be construed to supersede or replace any prior agreements containing confidentiality, nondisclosure, non-competition and non-solicitation provisions. Rather, the restrictions in this Agreement shall be read together with such prior agreements to afford the Company and its Subsidiaries the broadest protections allowed by law. (vi) If a court finds any of the Agreement’s restrictions unenforceable as written, the parties agree the court is authorized and expected under the terms of this Agreement to revise the restriction (for the jurisdiction covered by that court only) so as to make it enforceable, or if such revision is not permitted then to enforce the otherwise unreasonable or unenforceable restriction to such lesser extent as would be deemed reasonable and lawful within that jurisdiction. (vii) If Holder resides in California: Sections 13(b) and (d) shall not apply; Section 13(c) shall only apply if Holder uses or discloses the Company’s or its Subsidiaries’ trade secrets per Cal. Bus. & Prof. Code §16600; and Section 18 shall not apply.
|
14. |
Decisions of Board or Committee. The Board or the Committee has the right to resolve all questions which may arise in connection with the Award. Any interpretation, determination or other action made or taken by the Board or the Committee regarding the Plan or this Agreement is final and binding. |
|
|
15. |
Successors. This Agreement is binding upon and will inure to the benefit of any successor or successors of the Company and any person or persons who, upon the death of Holder, may acquire any rights in accordance with this Agreement or the Plan. |
|
|
16. |
Notices. All notices, requests or other communications provided for in this Agreement will be made, if to the Company, to Fortune Brands Home &Security, Inc., Attn. General Counsel, 520 Lake Cook Road, Deerfield, Illinois 60015, and if to Holder, to the last known mailing address of Holder contained in the records of the Company. All notices, requests or other communications provided for in this Agreement will be made in writing either (a) by personal delivery; (b) by facsimile or electronic mail with confirmation of receipt; (c) by mailing in the United States mails; or (d) by express courier service. The notice, request or other communication will be deemed to be received upon personal delivery, upon confirmation of receipt of facsimile or electronic mail transmission or upon receipt by the intended party if by United States mail or express courier service; provided, however, that if a notice, request or other communication sent to the Company is not received during regular business hours, it will be deemed to be received on the next succeeding business day of the Company. |
|
|
17. |
Partial Invalidity. The invalidity or unenforceability of any particular provision of this Agreement will not affect any other provisions of this Agreement and this Agreement will be construed in all respects as if such invalid or unenforceable provisions were omitted. |
|
|
18. |
Governing Law. This Agreement, the Award and all determinations made and actions taken with respect to this Agreement or Award, to the extent not governed by the Code or the laws of the United States, will be governed by, and construed in accordance with, the laws of the State of Delaware without giving effect to principles of conflicts of laws. |
|
|
19. |
Agreement Subject to the Plan. This Agreement is subject to, and will be interpreted in accordance with, the Plan. In the event of a conflict between this Agreement and the Plan, the terms of the Plan will apply . Holder hereby acknowledges receipt of a copy of the Plan, and by accepting the Award in the manner specified by the Company, he or she agrees to be bound by the terms and conditions of this Agreement, the Award, the Plan, and if applicable to the Holder, stock ownership guidelines established by the Company. |
|
|
arise in connection with any amounts payable under this Agreement. To the extent any amounts under this Agreement are payable by reference to Holder’s “termination of employment,” such term will be deemed to refer to Holder’s “separation from service,” within the meaning of Section 409A of the Code. Notwithstanding any other provision in this Agreement, if Holder is a “specified employee,” as defined in Section 409A of the Code, as of the date of Holder’s separation from service, then to the extent any amount payable to Holder (a) is payable upon Holder’s separation from service, and (b) under the terms of this Agreement would be payable prior to the six-month anniversary of Holder’s separation from service, to the extent that payment under this Agreement is otherwise subject to the provisions of Section 409A of the Code, such payment will be delayed until the earlier to occur of: (x) the six-month anniversary of Holder’s separation from service and (y) the date of Holder’s death. If any applicable payment period begins in one calendar year and ends in the following calendar year, Holder shall not have the right to designate the year of the payment. |
|
|
21. |
Counterparts. This Agreement may be executed in one or more counterparts, all of which together will constitute but one Agreement. |
|
Exhibit 21
The following is a list of significant subsidiaries as of the date hereof and includes the state or other jurisdiction of incorporation. Except as indicated below, each subsidiary does business under its own name. The names of certain subsidiaries are omitted. Such subsidiaries would not, if considered in the aggregate as a single subsidiary, constitute a significant subsidiary within the meaning of Item 601(b)(21)(ii) of Regulation S-K.
|
Name of Company |
|
Place of Incorporation |
|
|
|
|
|
Fortune Brands Storage & Security LLC |
|
Delaware |
|
Master Lock Company LLC |
|
Delaware |
|
Fortune Brands Doors, Inc. |
|
Delaware |
|
Therma-Tru Corp. |
|
Ohio |
|
MasterBrand Cabinets, Inc. |
|
Delaware |
|
Fortune Brands Global Plumbing Group Holdings II LLC |
|
Delaware |
|
Fortune Brands Global Plumbing Group Holdings III LLC |
|
Delaware |
|
Global Plumbing Group Holdings LLC |
|
Delaware |
|
Moen Incorporated |
|
Delaware |
|
Norcraft Holding LLC |
|
North Carolina |
|
Norcraft Companies, Inc. |
|
Delaware |
Exhibit 23
CONSENT OF INDEPENDENT REGISTERED PUBLIC ACCOUNTING FIRM
We hereby consent to the incorporation by reference in the Registration Statement on Form S-8 (Nos. 333-188598, 333-177164, 333-177163, 333-177145) and Form S-3 (No. 333-224612) of Fortune Brands Home & Security, Inc. of our report dated February 26, 2020 relating to the financial statements, financial statement schedule and the effectiveness of internal control over financial reporting, which appears in this Form 10-K.
/s/ Pricewaterhouse Coopers
Chicago, IL
February 26, 2020
Exhibit 24
POWER OF ATTORNEY
Each of the undersigned, acting in the capacity or capacities stated next to their respective names below, constitute and appoint NICHOLAS I. FINK and ROBERT K. BIGGART, and each of them severally, as his or her true and lawful attorney-in-fact and agent, with full power of substitution, to sign for and in the name of the undersigned in the capacities indicated below, the Annual Report on Form 10-K of Fortune Brands Home & Security, Inc. for the fiscal year ended December 31, 2019, and any and all amendments thereto, and to file the same with all exhibits thereto, and other documents in connection therewith, with the Securities and Exchange Commission, granting unto said attorneys-in-fact and agents, full power and authority to do and perform each and every act and thing requisite and necessary to be done in connection therewith, as fully to all intents and purposes as he or she might or could do in person, hereby ratifying and confirming all that said attorneys-in-fact and agents may lawfully do or cause to be done by virtue hereof.
|
Signature |
|
Title |
|
Date |
|
|
|
|
|
|
|
/s/ Nicholas I. Fink |
|
Chief Executive Officer |
|
February 24 , 2020 |
|
Nicholas I. Fink |
|
(principal executive officer) |
|
|
|
|
|
|
|
|
|
|
|
|
|
|
|
/s/ Patrick D. Hallinan |
|
Senior Vice President and |
|
February 24 , 2020 |
|
Patrick D. Hallinan |
|
Chief Financial Officer |
|
|
|
|
|
(principal financial officer) |
|
|
|
|
|
|
|
|
|
|
|
|
|
|
|
/s/ Danny Luburic |
|
Vice President and |
|
February 24 , 2020 |
|
Danny Luburic |
|
Corporate Controller |
|
|
|
|
|
(principal accounting officer) |
|
|
|
|
|
|
|
|
|
|
|
|
|
|
|
/s/ Christopher J. Klein |
|
Executive Chairman of the |
|
February 24 , 2020 |
|
Christopher J. Klein |
|
Board of Directors |
|
|
|
|
|
|
|
|
|
|
|
|
|
|
|
/s/ Irial Finan |
|
Director |
|
February 24 , 2020 |
|
Irial Finan |
|
|
|
|
|
|
|
|
|
|
|
|
|
|
|
|
|
/s/ Ann F. Hackett |
|
Director |
|
February 24 , 2020 |
|
Ann F. Hackett |
|
|
|
|
|
|
|
|
|
|
|
|
|
|
|
|
|
/s/ Susan S. Kilsby |
|
Director |
|
February 24 , 2020 |
|
Susan S. Kilsby |
|
|
|
|
|
|
|
|
|
|
|
|
|
|
|
|
|
/s/ A. D. David Mackay |
|
Director |
|
February 24 , 2020 |
|
A. D. David Mackay |
|
|
|
|
|
|
|
|
|
|
|
|
|
|
|
|
|
/s/ John G. Morikis |
|
Director |
|
February 24 , 2020 |
|
John G. Morikis |
|
|
|
|
|
|
|
|
|
|
|
|
|
|
|
|
|
/s/ David M. Thomas |
|
Director |
|
February 24 , 2020 |
|
David M. Thomas |
|
|
|
|
|
|
|
|
|
|
|
|
|
|
|
|
|
/s/ Ronald V. Waters, III |
|
Director |
|
February 24 , 2020 |
|
Ronald V. Waters, III |
|
|
|
|
EXHIBIT 31.1
CERTIFICATION
I, Nicholas I. Fink, certify that:
|
1. |
I have reviewed this annual report on Form 10-K for the year ended December 31, 2019 of Fortune Brands Home & Security, Inc.; |
|
2. |
Based on my knowledge, this report does not contain any untrue statement of a material fact or omit to state a material fact necessary to make the statements made, in light of the circumstances under which such statements were made, not misleading with respect to the period covered by this report; |
|
3. |
Based on my knowledge, the financial statements, and other financial information included in this report, fairly present in all material respects the financial condition, results of operations and cash flows of the registrant as of, and for, the periods presented in this report; |
|
4. |
The registrant’s other certifying officer(s) and I are responsible for establishing and maintaining disclosure controls and procedures (as defined in Exchange Act Rules 13a-15(e) and 15d-15(e)) and internal control over financial reporting (as defined in Exchange Act Rules 13a-15(f) and 15d-15(f)) for the registrant and have: |
|
|
a) |
Designed such disclosure controls and procedures, or caused such disclosure controls and procedures to be designed under our supervision, to ensure that material information relating to the registrant, including its consolidated subsidiaries, is made known to us by others within those entities, particularly during the period in which this report is being prepared; |
|
|
b) |
Designed such internal control over financial reporting, or caused such internal control over financial reporting to be designed under our supervision, to provide reasonable assurance regarding the reliability of financial reporting and the preparation of financial statements for external purposes in accordance with generally accepted accounting principles; |
|
|
c) |
Evaluated the effectiveness of the registrant’s disclosure controls and procedures and presented in this report our conclusions about the effectiveness of the disclosure controls and procedures, as of the end of the period covered by this report based on such evaluation; and |
|
|
d) |
Disclosed in this report any change in the registrant’s internal control over financial reporting that occurred during the registrant’s most recent fiscal quarter (the registrant’s fourth fiscal quarter in the case of an annual report) that has materially affected, or is reasonably likely to materially affect, the registrant’s internal control over financial reporting; and |
|
5. |
The registrant’s other certifying officer(s) and I have disclosed, based on our most recent evaluation of internal control over financial reporting, to the registrant’s auditors and the audit committee of the registrant’s board of directors (or persons performing the equivalent functions): |
|
|
a) |
All significant deficiencies and material weaknesses in the design or operation of internal control over financial reporting which are reasonably likely to adversely affect the registrant’s ability to record, process, summarize and report financial information; and |
|
|
b) |
Any fraud, whether or not material, that involves management or other employees who have a significant role in the registrant's internal control over financial reporting. |
|
/s/ Nicholas I. Fink |
|
Nicholas I. Fink |
|
Chief Executive Officer |
Date: February 26, 2020
EXHIBIT 31.2
CERTIFICATION
I, Patrick D. Hallinan, certify that:
|
1. |
I have reviewed this annual report on Form 10-K for the year ended December 31, 2019 of Fortune Brands Home & Security, Inc.; |
|
2. |
Based on my knowledge, this report does not contain any untrue statement of a material fact or omit to state a material fact necessary to make the statements made, in light of the circumstances under which such statements were made, not misleading with respect to the period covered by this report; |
|
3. |
Based on my knowledge, the financial statements, and other financial information included in this report, fairly present in all material respects the financial condition, results of operations and cash flows of the registrant as of, and for, the periods presented in this report; |
|
4. |
The registrant’s other certifying officer(s) and I are responsible for establishing and maintaining disclosure controls and procedures (as defined in Exchange Act Rules 13a-15(e) and 15d-15(e)) and internal control over financial reporting (as defined in Exchange Act Rules 13a-15(f) and 15d-15(f)) for the registrant and have: |
|
|
a) |
Designed such disclosure controls and procedures, or caused such disclosure controls and procedures to be designed under our supervision, to ensure that material information relating to the registrant, including its consolidated subsidiaries, is made known to us by others within those entities, particularly during the period in which this report is being prepared; |
|
|
b) |
Designed such internal control over financial reporting, or caused such internal control over financial reporting to be designed under our supervision, to provide reasonable assurance regarding the reliability of financial reporting and the preparation of financial statements for external purposes in accordance with generally accepted accounting principles; |
|
|
c) |
Evaluated the effectiveness of the registrant’s disclosure controls and procedures and presented in this report our conclusions about the effectiveness of the disclosure controls and procedures, as of the end of the period covered by this report based on such evaluation; and |
|
|
d) |
Disclosed in this report any change in the registrant’s internal control over financial reporting that occurred during the registrant’s most recent fiscal quarter (the registrant’s fourth fiscal quarter in the case of an annual report) that has materially affected, or is reasonably likely to materially affect, the registrant’s internal control over financial reporting; and |
|
5. |
The registrant’s other certifying officer(s) and I have disclosed, based on our most recent evaluation of internal control over financial reporting, to the registrant’s auditors and the audit committee of the registrant’s board of directors (or persons performing the equivalent functions): |
|
|
a) |
All significant deficiencies and material weaknesses in the design or operation of internal control over financial reporting which are reasonably likely to adversely affect the registrant’s ability to record, process, summarize and report financial information; and |
|
|
b) |
Any fraud, whether or not material, that involves management or other employees who have a significant role in the registrant's internal control over financial reporting. |
Date: February 26, 2020
|
/s/ Patrick D. Hallinan |
|
Patrick Hallinan |
|
Senior Vice President and |
|
Chief Financial Officer |
EXHIBIT 32
JOINT CEO/CFO CERTIFICATE REQUIRED
UNDER SECTION 906 OF THE SARBANES-OXLEY ACT OF 2002
Each of the undersigned, the Chief Executive Officer and the Senior Vice President and Chief Financial Officer of Fortune Brands Home & Security, Inc. (the “Company”), hereby certifies pursuant to 18 U.S.C. §1350, as adopted pursuant to Section 906 of the Sarbanes Oxley Act of 2002, that the Annual Report of the Company on Form 10-K for the year ended December 31, 2019 as filed with the Securities and Exchange Commission on the date hereof (the “Report”), fully complies with the requirements of section 13(a) or 15(d) of the Securities Exchange Act of 1934 and that the information contained in the Report fairly presents, in all material respects, the financial condition and the results of operations of the Company.
Dated: February 26, 2020
|
/s/ Nicholas I. Fink |
|
Nicholas I. Fink |
|
Chief Executive Officer |
|
/s/ Patrick D. Hallinan |
|
Patrick D. Hallinan |
|
Senior Vice President and |
|
Chief Financial Officer |
A signed original of this written statement required by Section 906 has been provided to Fortune Brands Home & Security, Inc. and will be retained by Fortune Brands Home & Security, Inc. and furnished to the Securities and Exchange Commission or its staff upon request.
1